Connect
Upload a SQLite/DuckDB file (or connect Postgres, MySQL, Oracle, SQL Server). Private, read-only, auto-limited.
A SQL data source is most powerful when you chain it with the rest of Catalyst. This tutorial walks the whole arc on one real dataset: connect a database, explore it by chatting, build a workflow that queries it on demand, and wire that workflow into an interactive app that pulls fresh data live.
We’ll use USDA FoodData Central — the U.S. government’s reference nutrition database — and end up with a parallel-coordinates app where you pick a food category and watch its foods plotted across six nutrients at once.
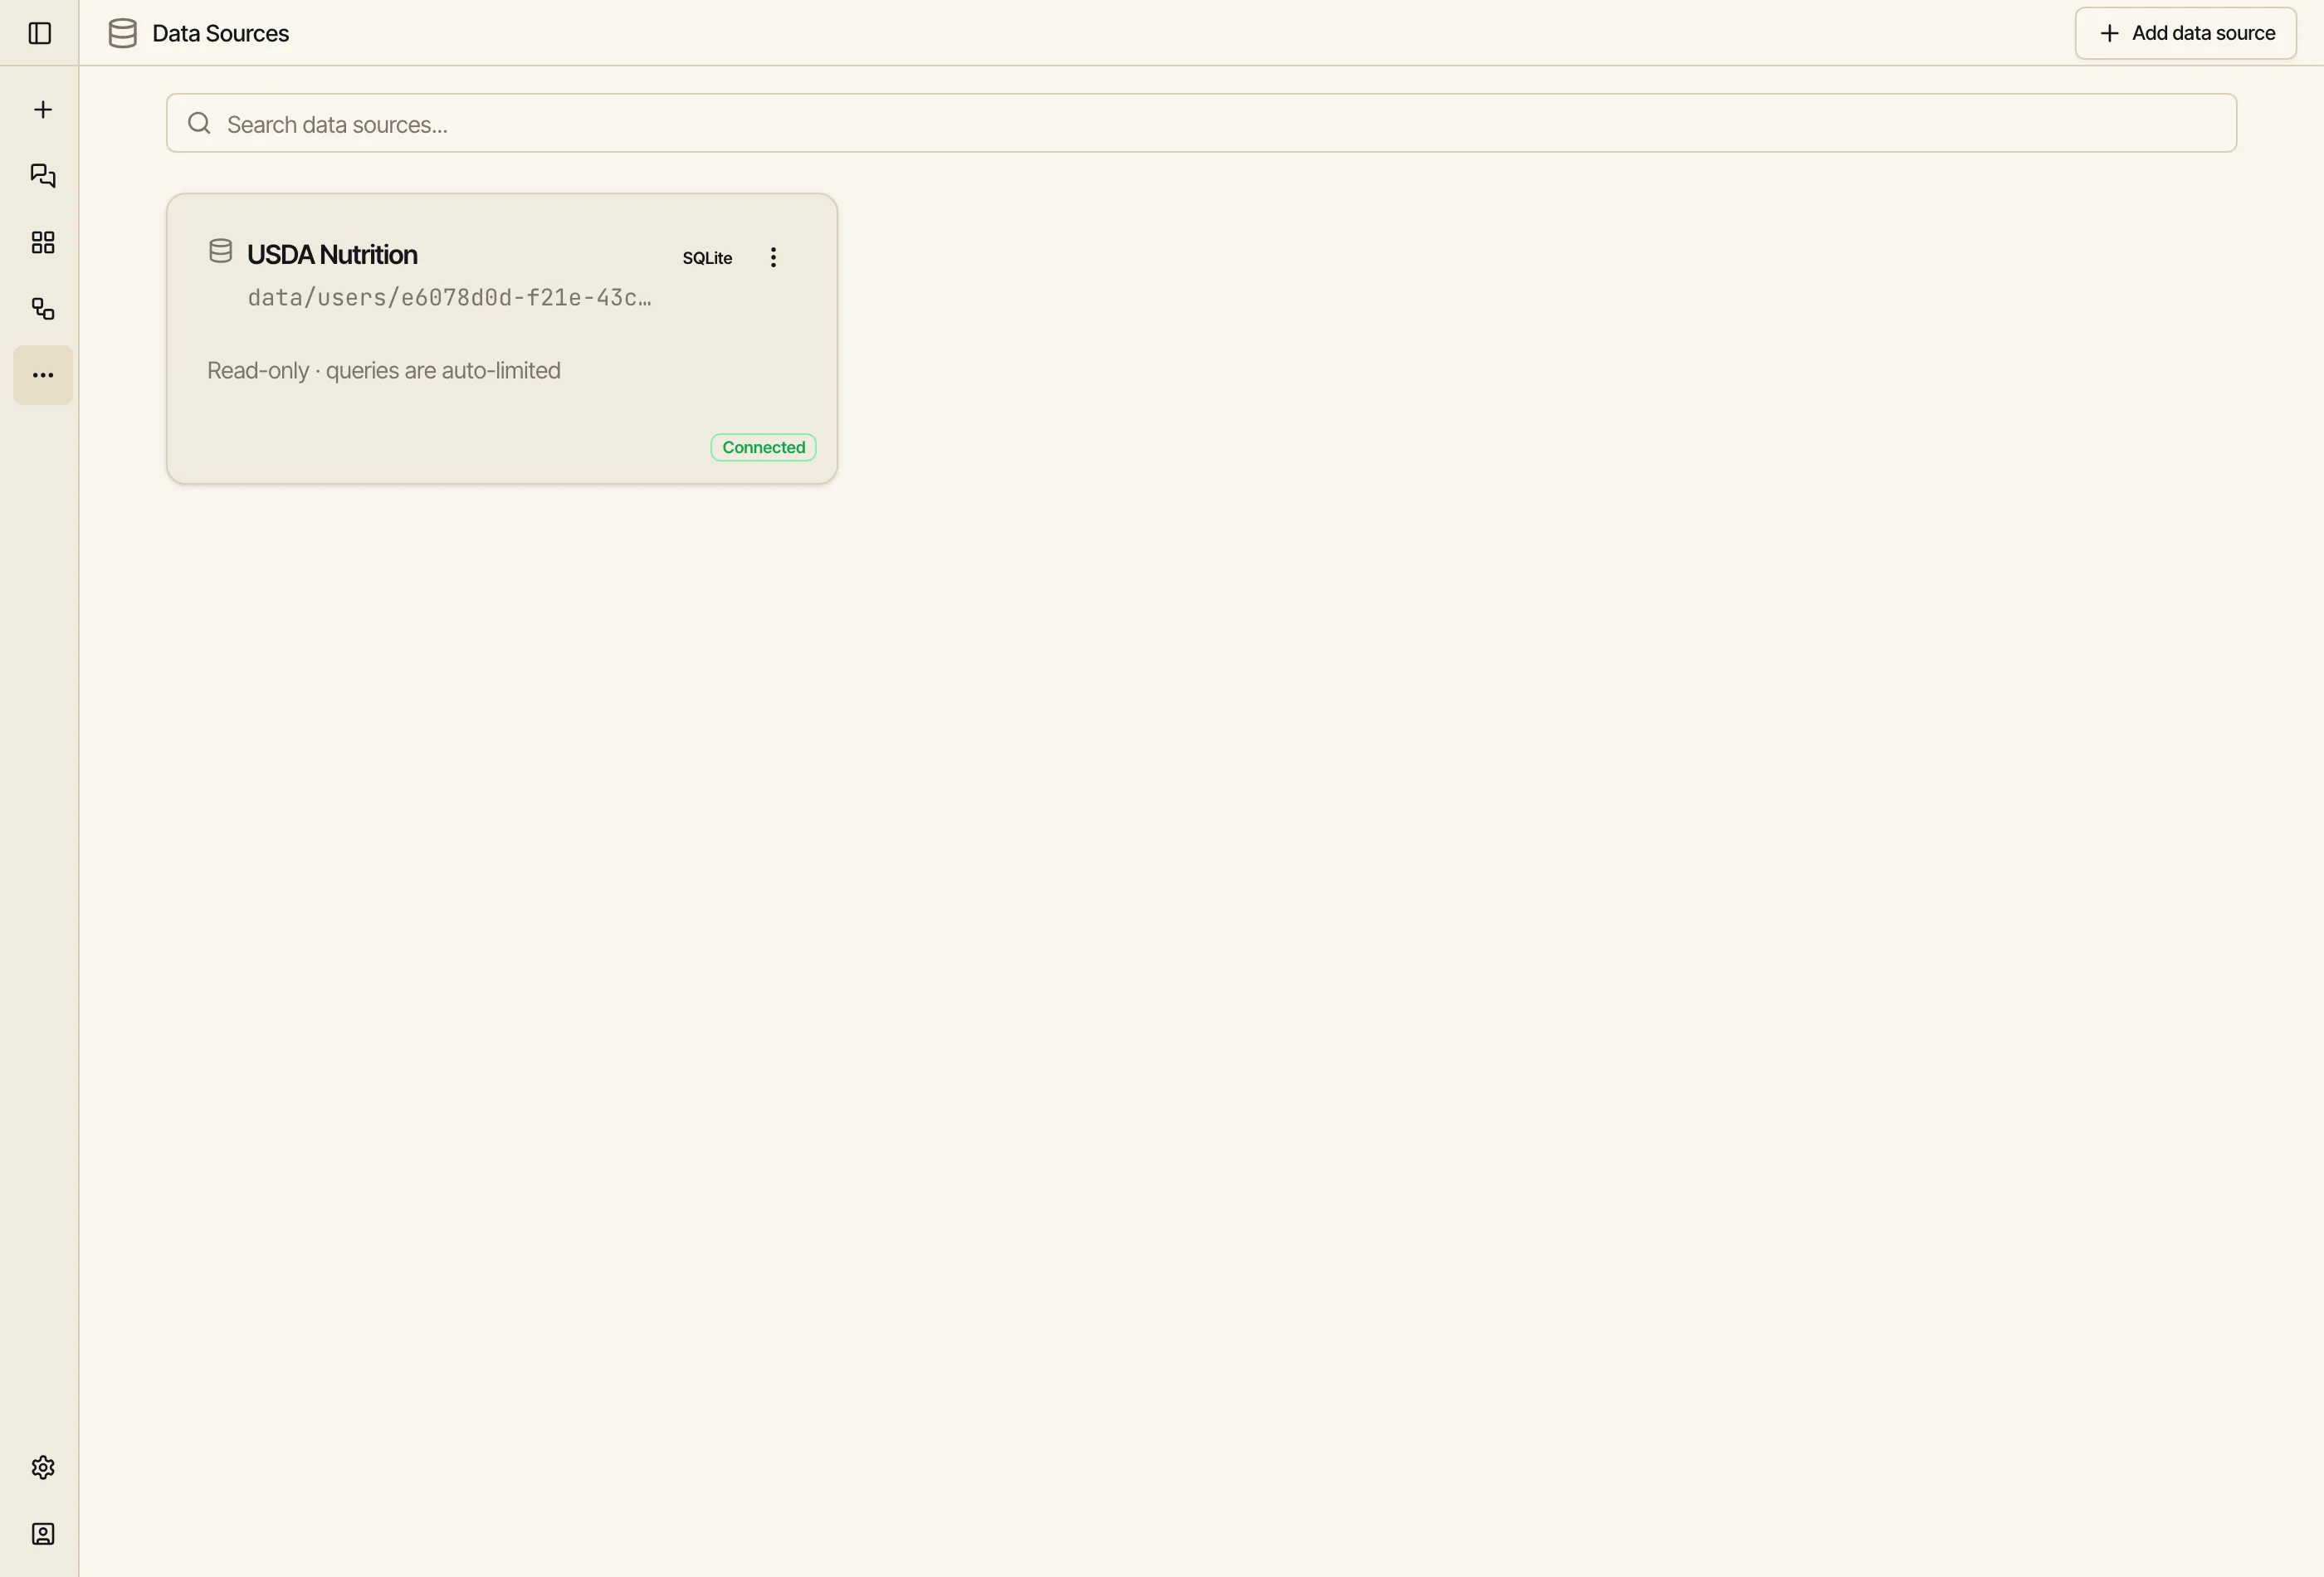
Open Data Sources from the sidebar → Add data source → pick the SQLite dialect. Instead of host fields you’ll get an upload box — drop the database file in.
Catalyst stores the file privately (only you can reach it), introspects the schema, and shows the source as Connected. Like every data source, it’s read-only and auto-limited — nothing you or the AI does can change a row, and no query can pull a whole table.
Click the source to open the SQL IDE. The schema browser lists the tables (food,
food_nutrient, nutrient, food_category, …); the editor runs read-only SQL. The nutrition
data is a classic star: food (the items) joins to food_nutrient (the values) which joins to
nutrient (what each value measures). Average protein by category is one join away:
SELECT c.description AS category, ROUND(AVG(fn.amount), 1) AS avg_protein_g, COUNT(*) AS foodsFROM food fJOIN food_category c ON f.food_category_id = c.idJOIN food_nutrient fn ON f.fdc_id = fn.fdc_idWHERE fn.nutrient_id = 1003 -- ProteinGROUP BY c.descriptionORDER BY avg_protein_g DESC;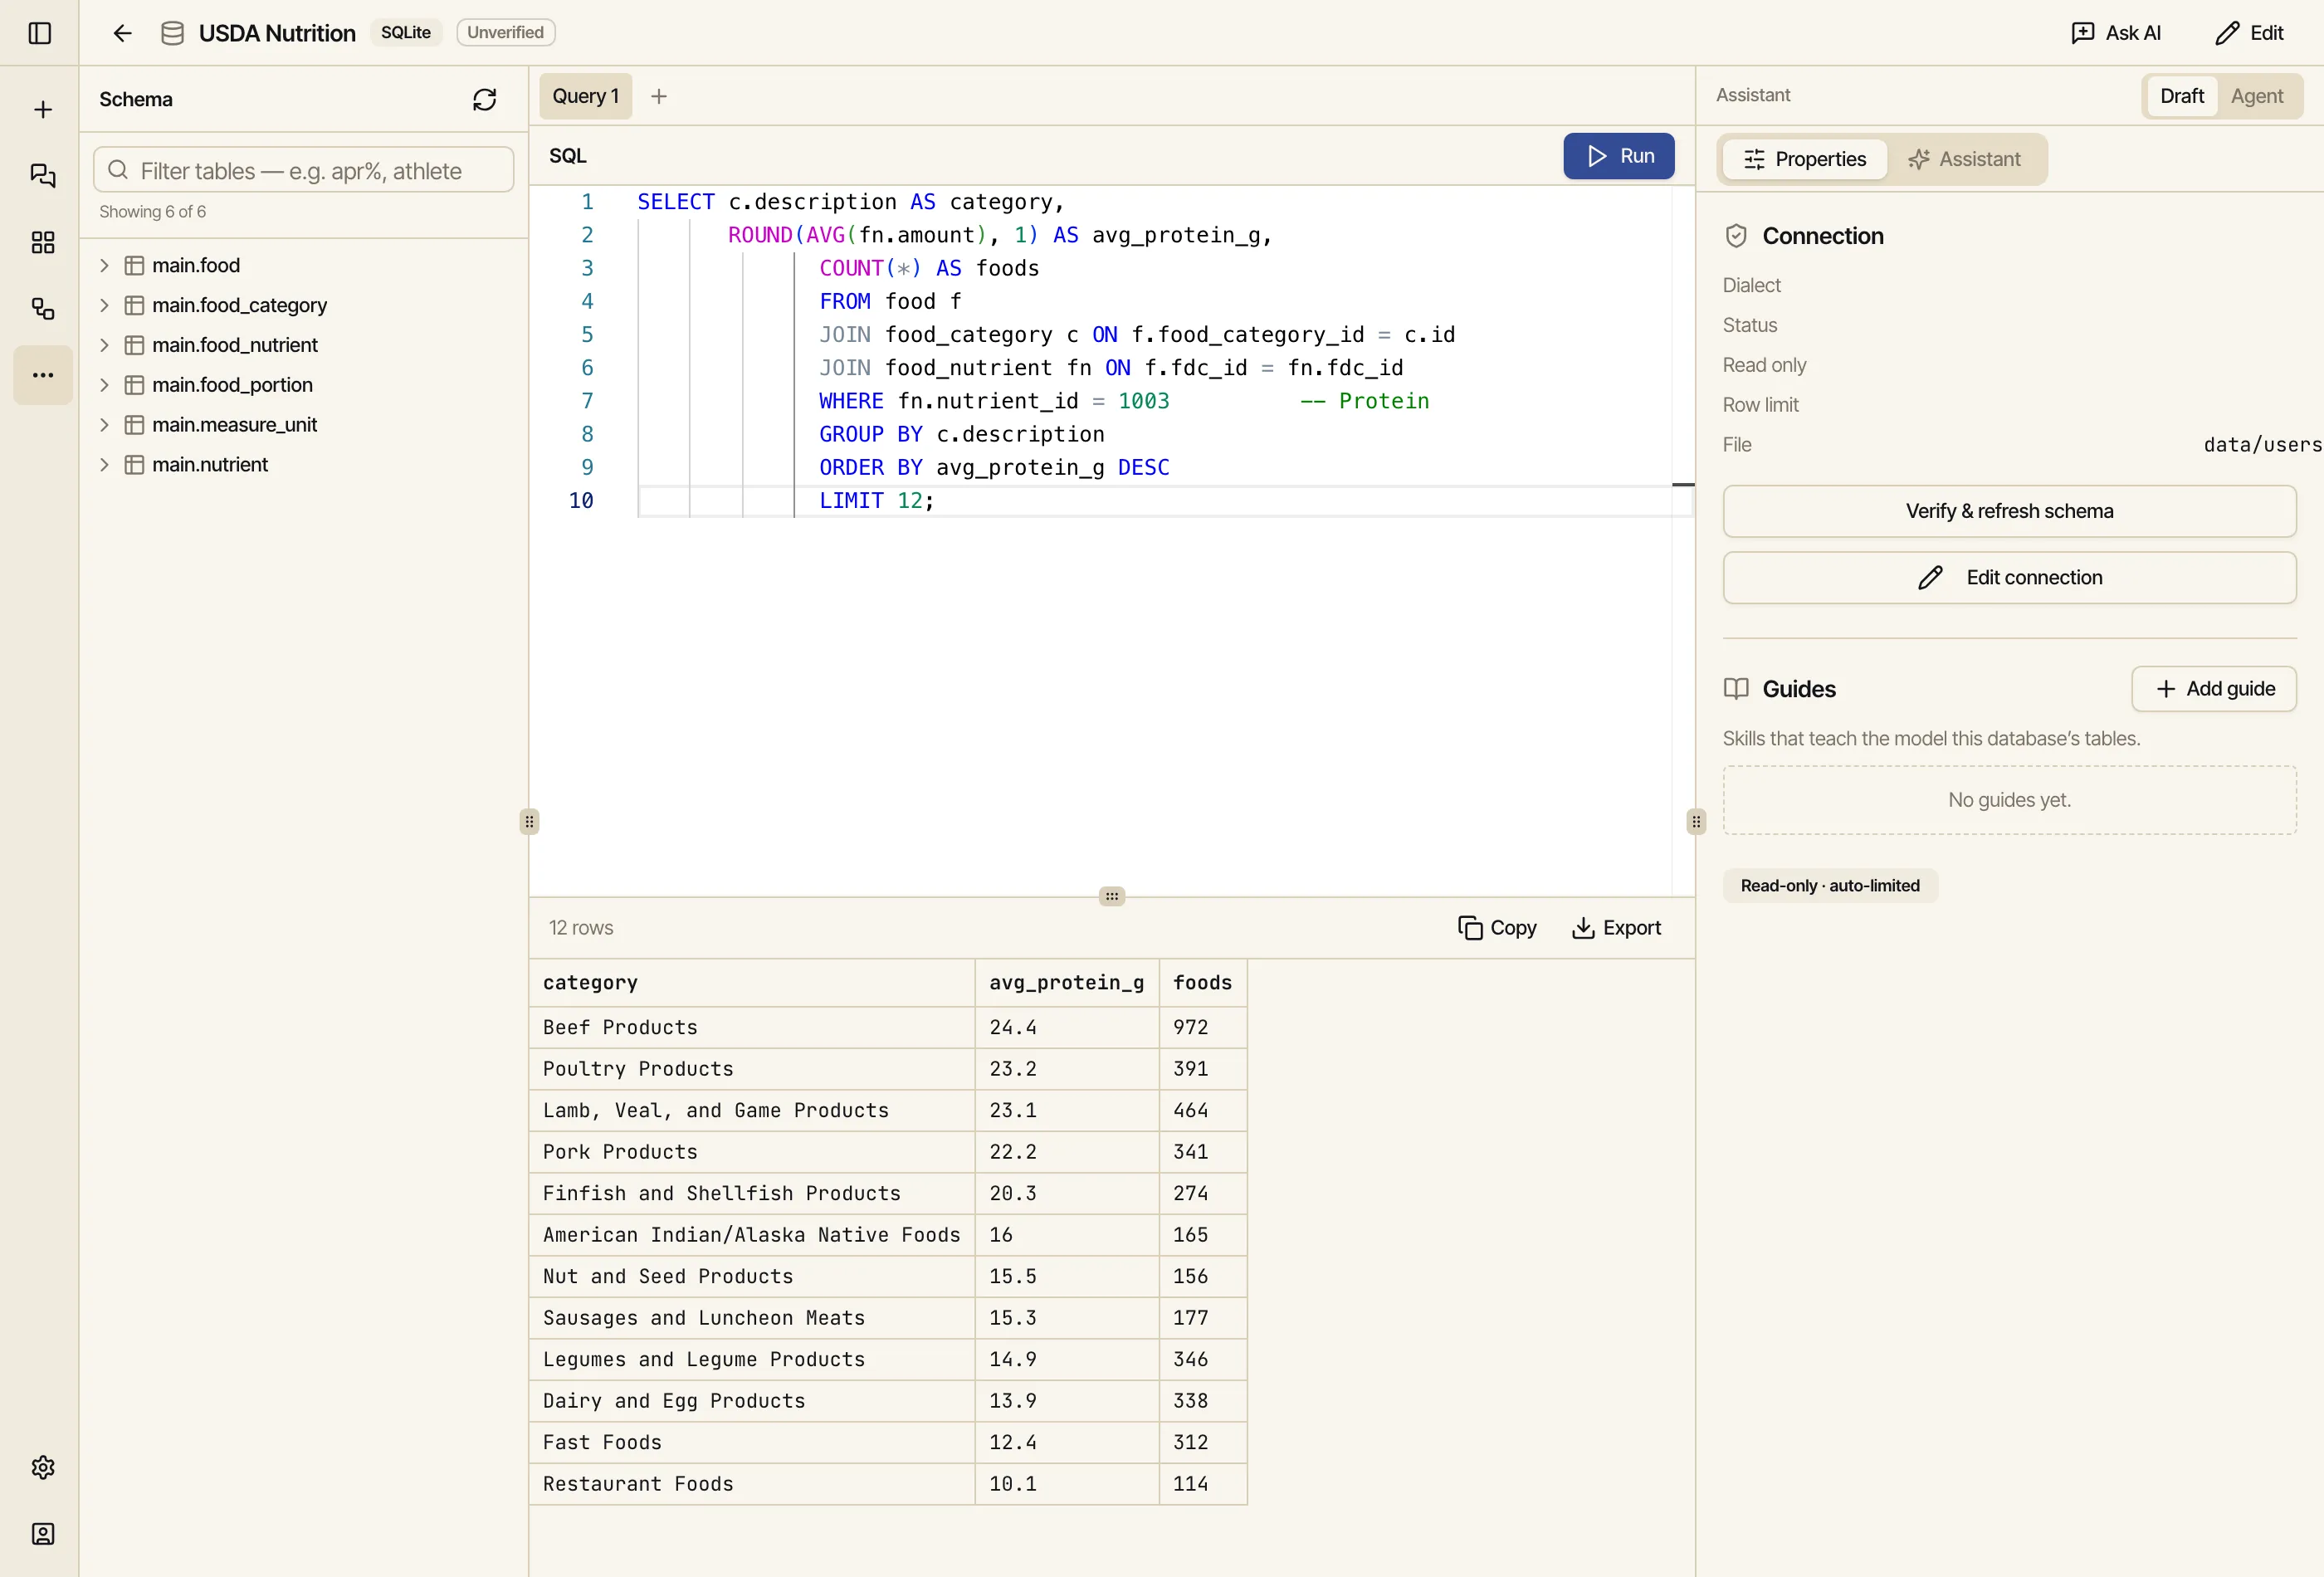
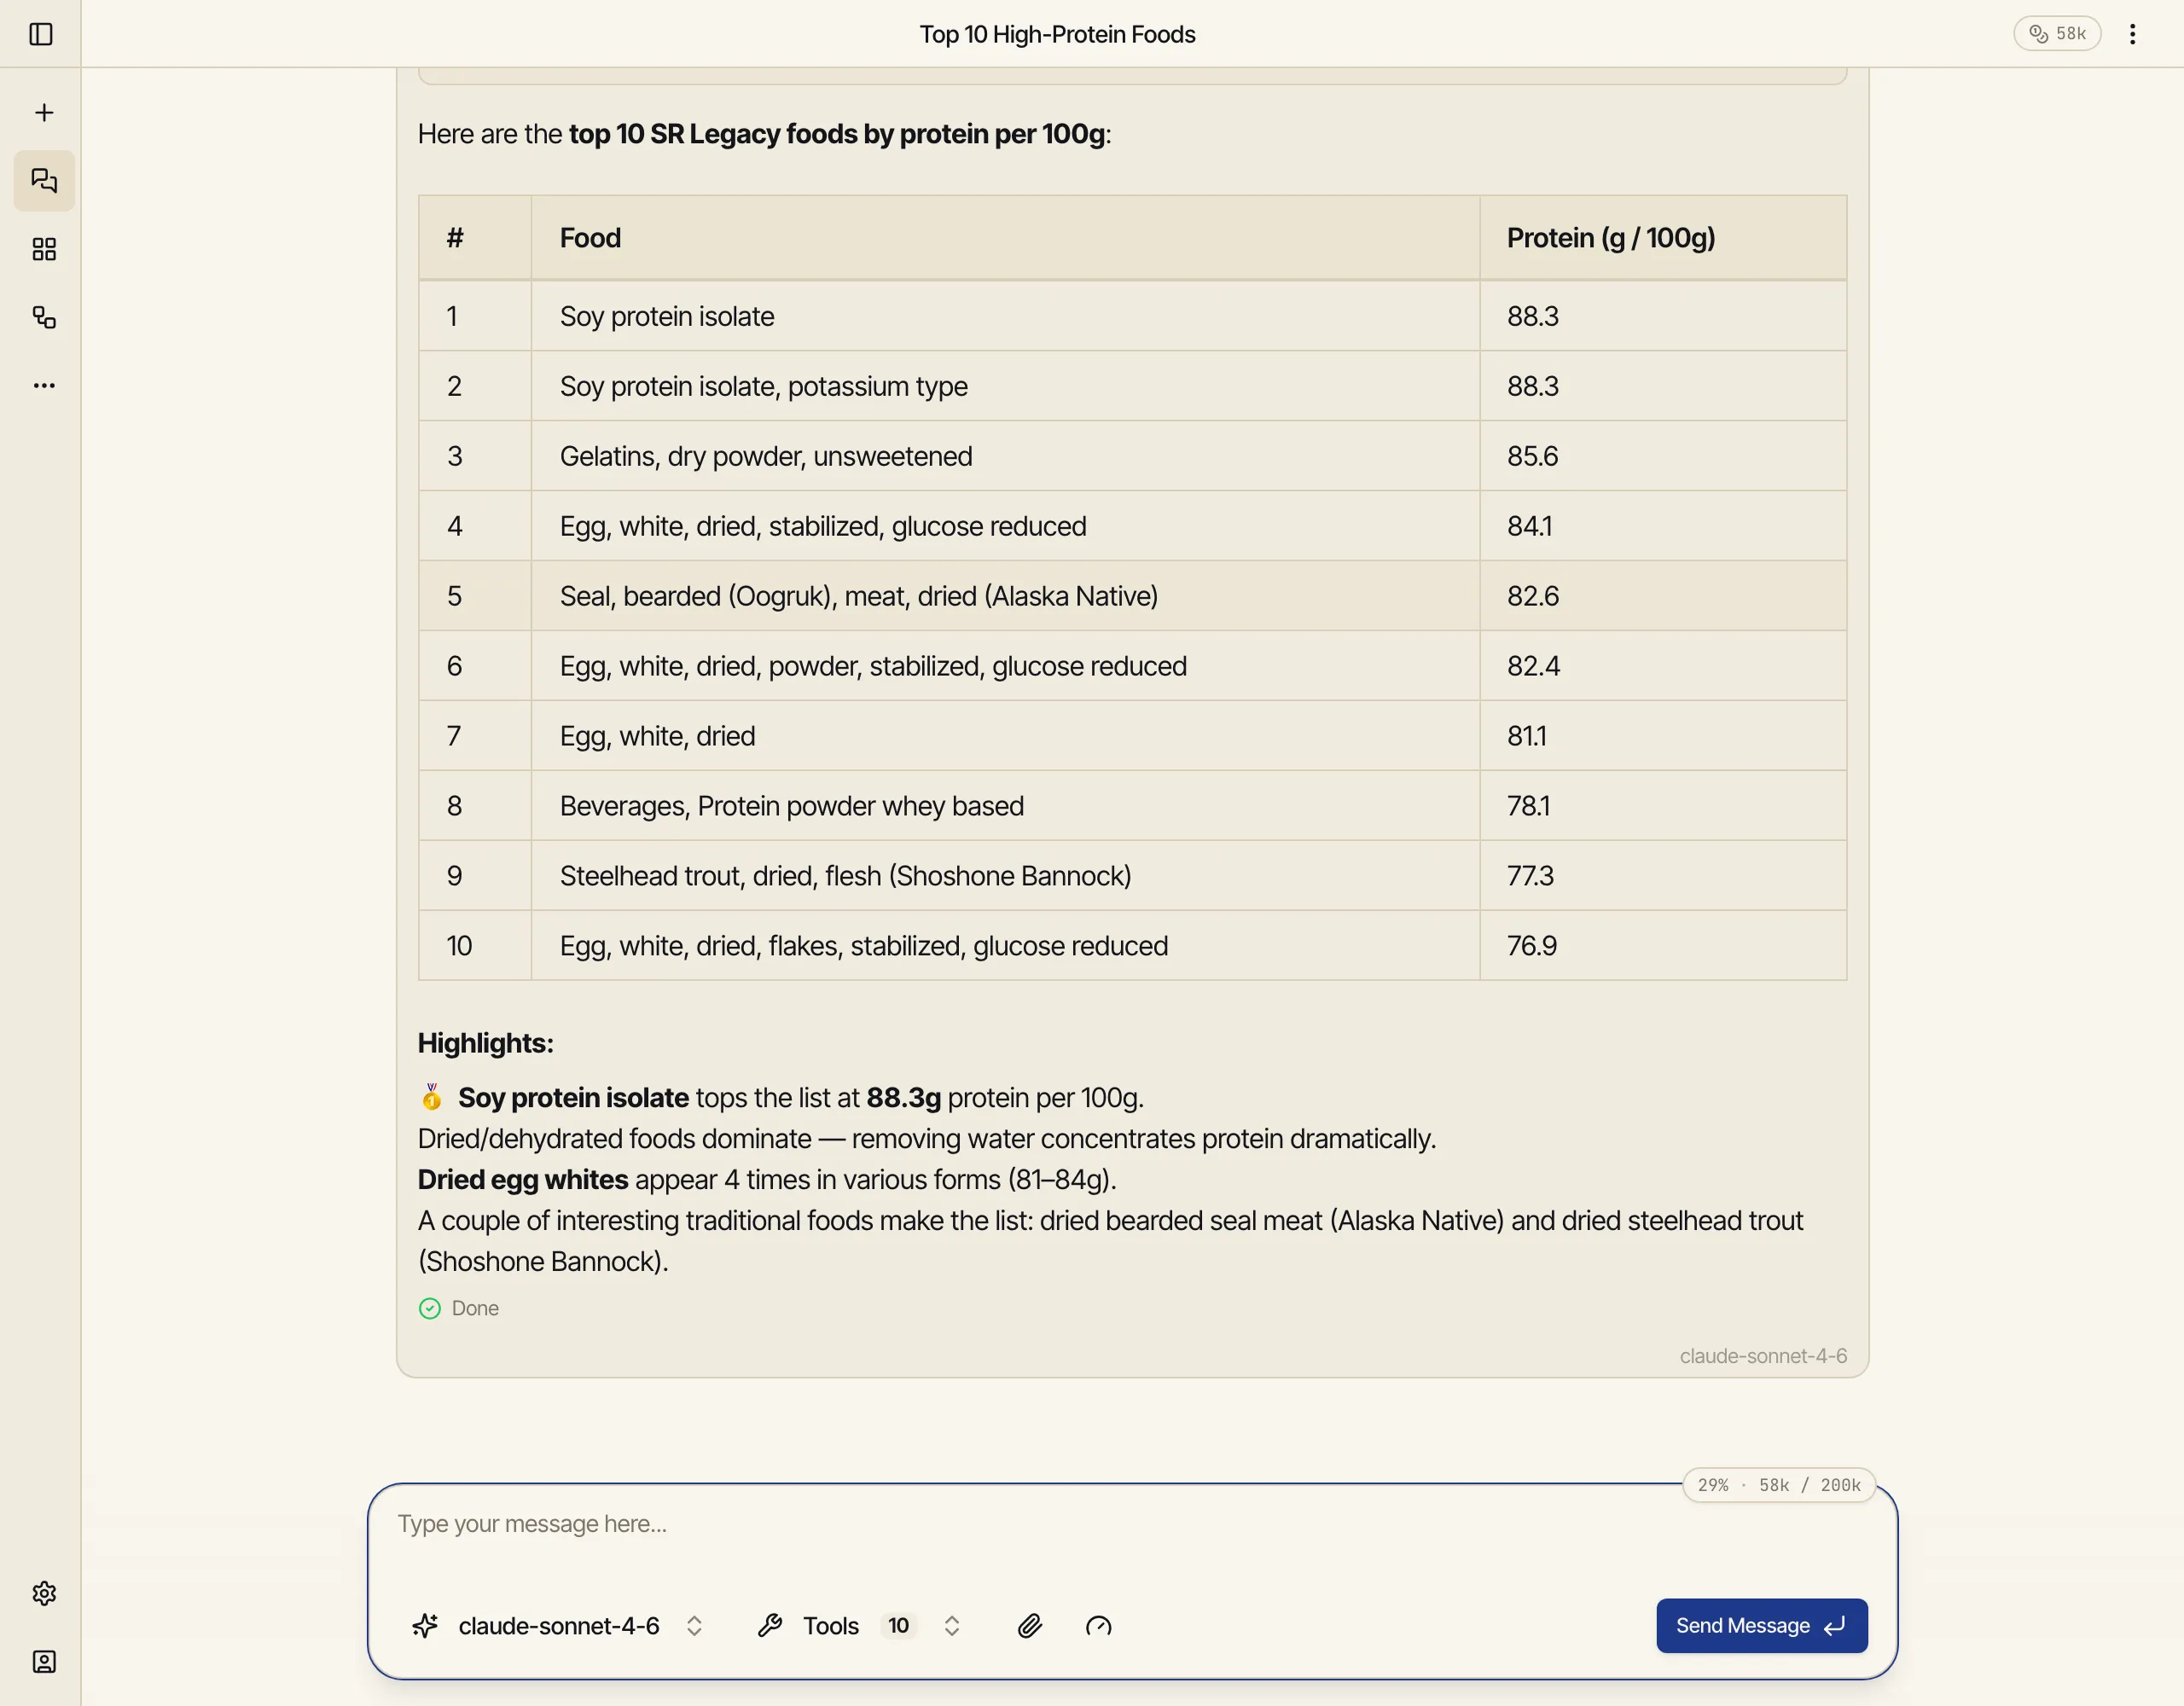
The IDE is there when you want to write SQL yourself — but you rarely have to. Start a chat
and just ask. Because the source is connected, the AI sees its schema and uses the built-in
sql tool to write and run the query for you, read-only:
Using my “USDA Nutrition” data source, find the 10 foods highest in protein per 100 g. Just run the SQL and show me a short table.
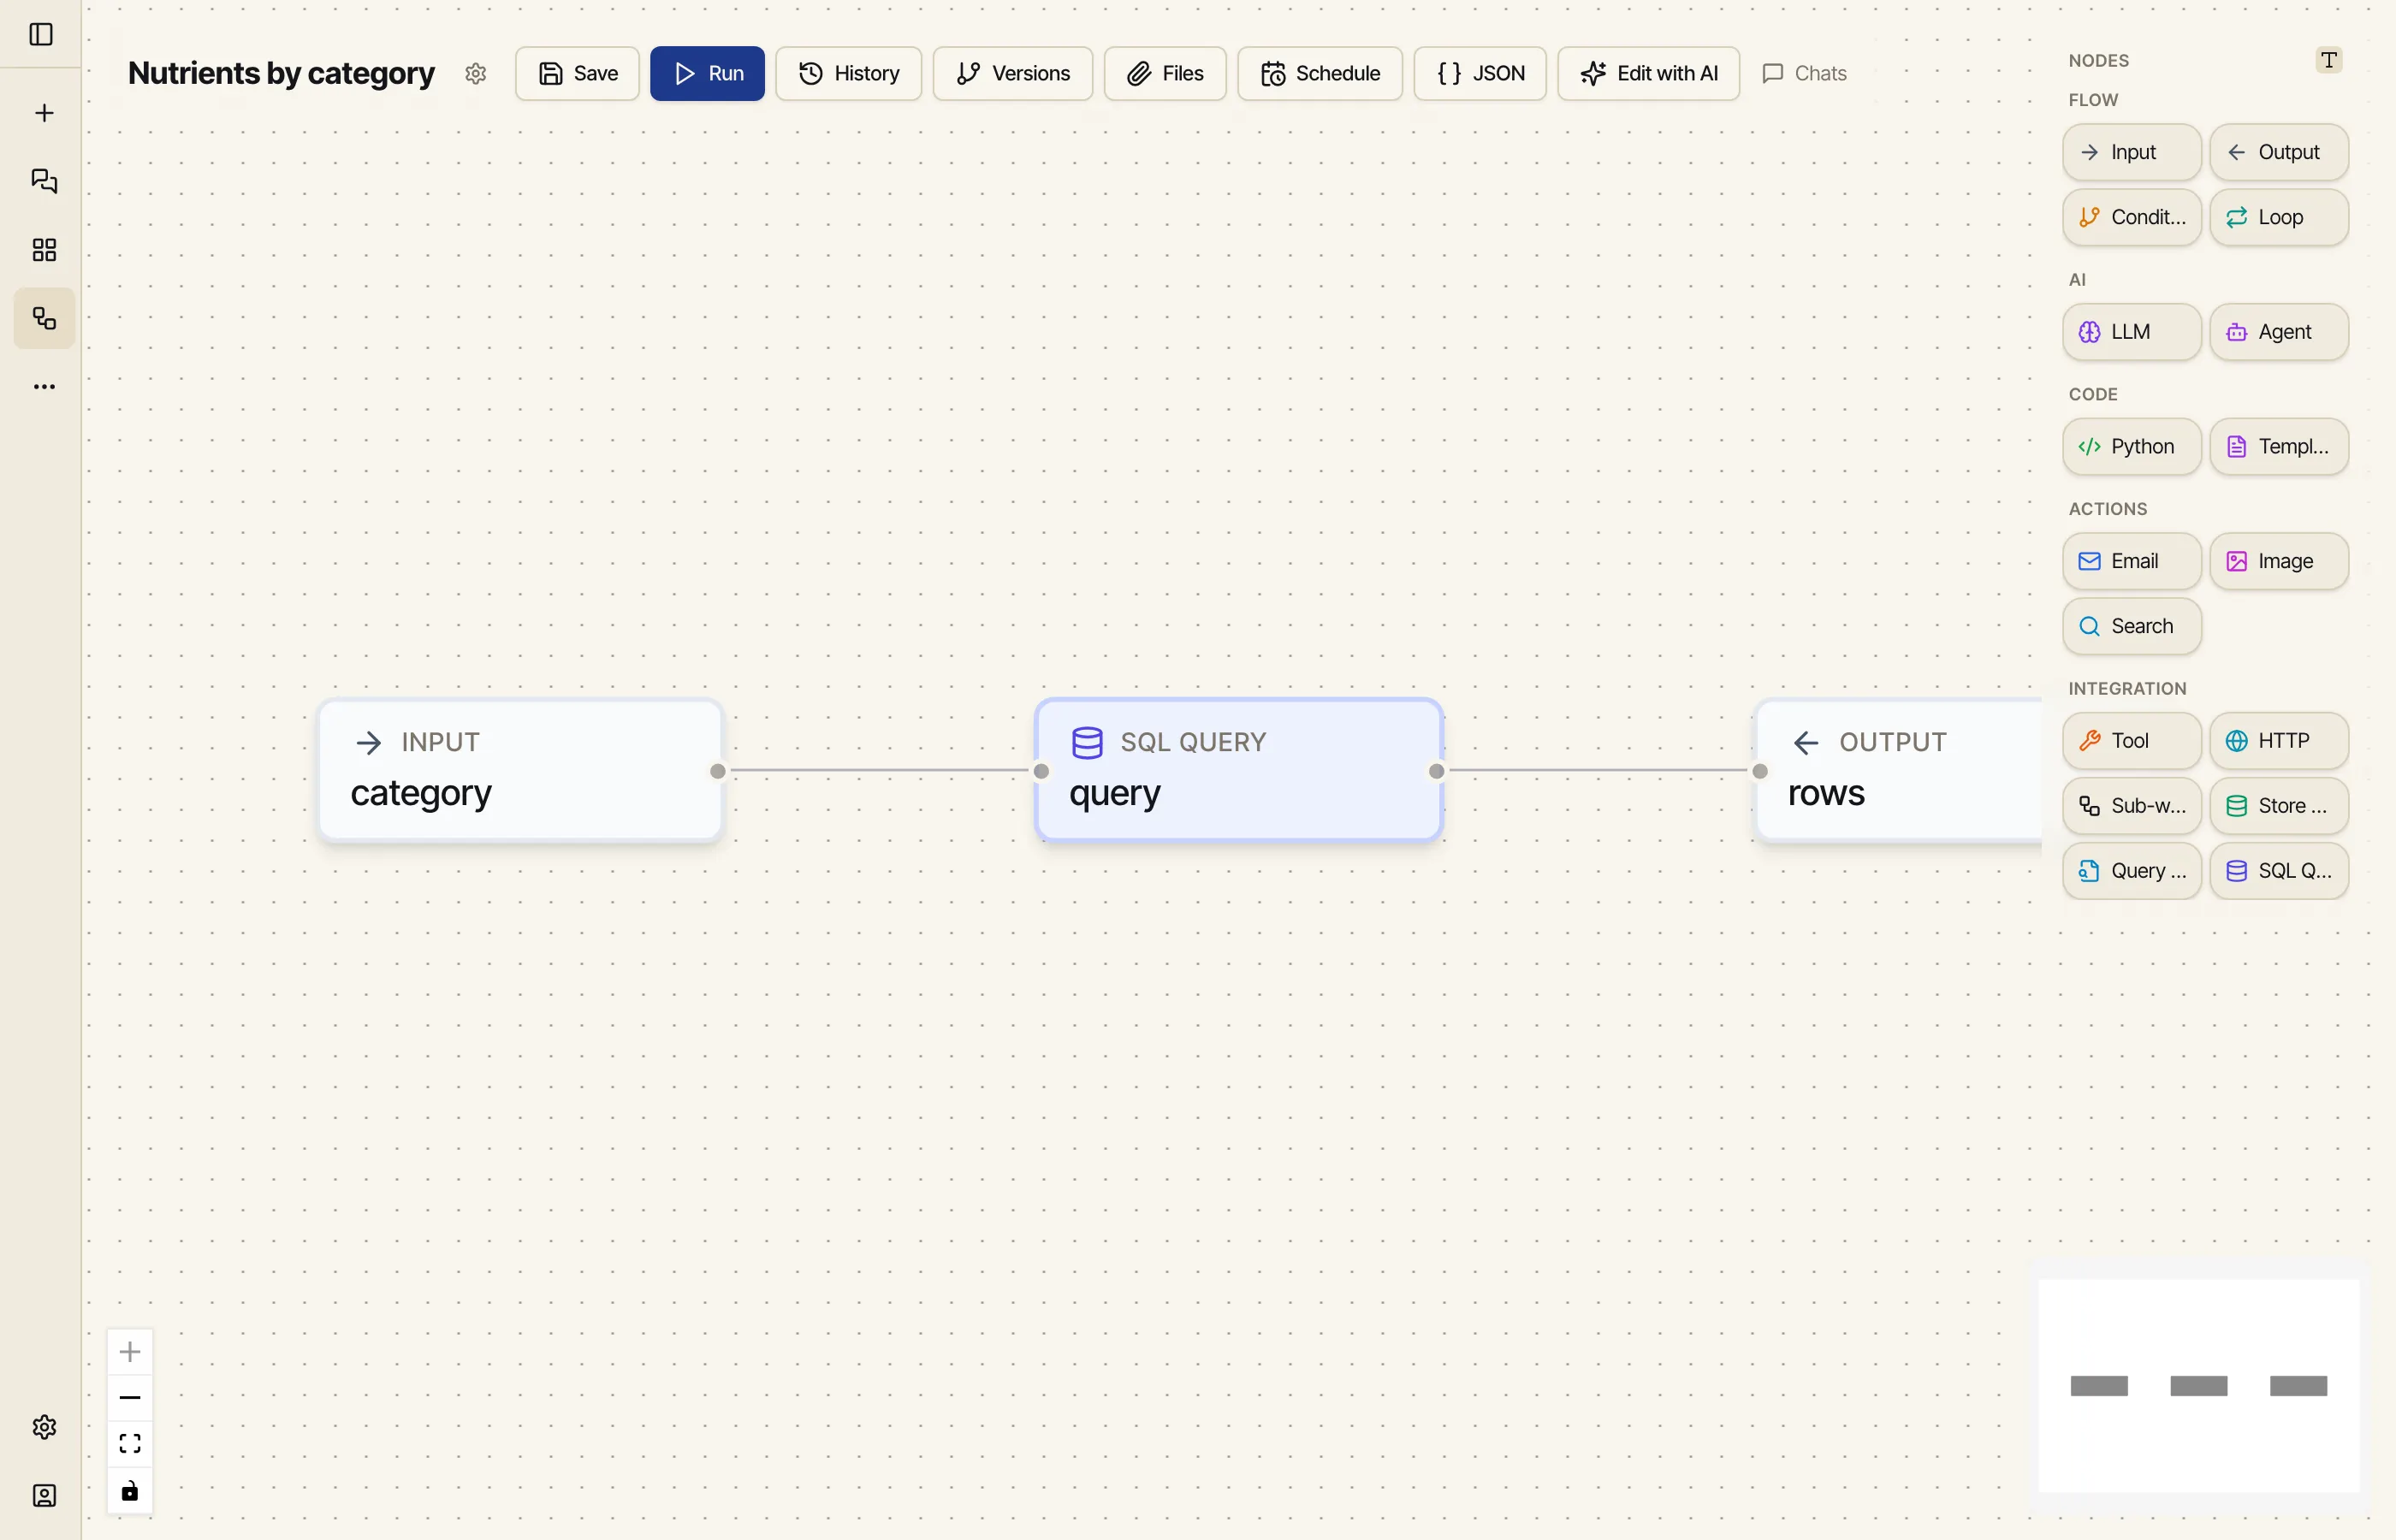
Exploring is interactive. To make the database callable — by a schedule, by an app, by another workflow — wrap a query in a workflow. We’ll build one that takes a category and returns that category’s foods with their core nutrients.
Three nodes:
An Input node declares one parameter: category.
A SQL node points at the USDA source and runs a query with a bind parameter, so the category is passed in safely (never string-glued into the SQL):
SELECT f.description AS food, MAX(CASE WHEN fn.nutrient_id = 1008 THEN fn.amount END) AS energy, MAX(CASE WHEN fn.nutrient_id = 1003 THEN fn.amount END) AS protein, MAX(CASE WHEN fn.nutrient_id = 1004 THEN fn.amount END) AS fat, MAX(CASE WHEN fn.nutrient_id = 1005 THEN fn.amount END) AS carbs, MAX(CASE WHEN fn.nutrient_id = 1079 THEN fn.amount END) AS fiber, MAX(CASE WHEN fn.nutrient_id = 1093 THEN fn.amount END) AS sodiumFROM food fJOIN food_category c ON f.food_category_id = c.idJOIN food_nutrient fn ON f.fdc_id = fn.fdc_idWHERE c.description = :catGROUP BY f.fdc_id;The SQL node’s params wire the input through: { "cat": "{{ input.parameters.category }}" }.
An Output node surfaces the rows.
Run it with category = "Sweets" and it returns the sweets; pass "Fruits and Fruit Juices"
and it returns fruits. Same read-only, auto-limited guarantees as the IDE — see the
Node reference for the SQL node’s inputs and outputs.
Now the payoff. Ask the AI to build a mini app — a parallel-coordinates chart with a category picker — and have it call the workflow instead of holding any data:
Build a mini app: a category dropdown plus a parallel-coordinates chart across Energy, Protein, Fat, Carbs, Fiber, and Sodium. When the category changes, run my “Nutrients by category” workflow and plot the foods it returns — one line each, hover to highlight.
The app holds no data of its own. On each category change it calls the workflow through the
app SDK (catalyst.workflows.run(...)), which runs the SQL
against your database and hands back the rows the chart draws:
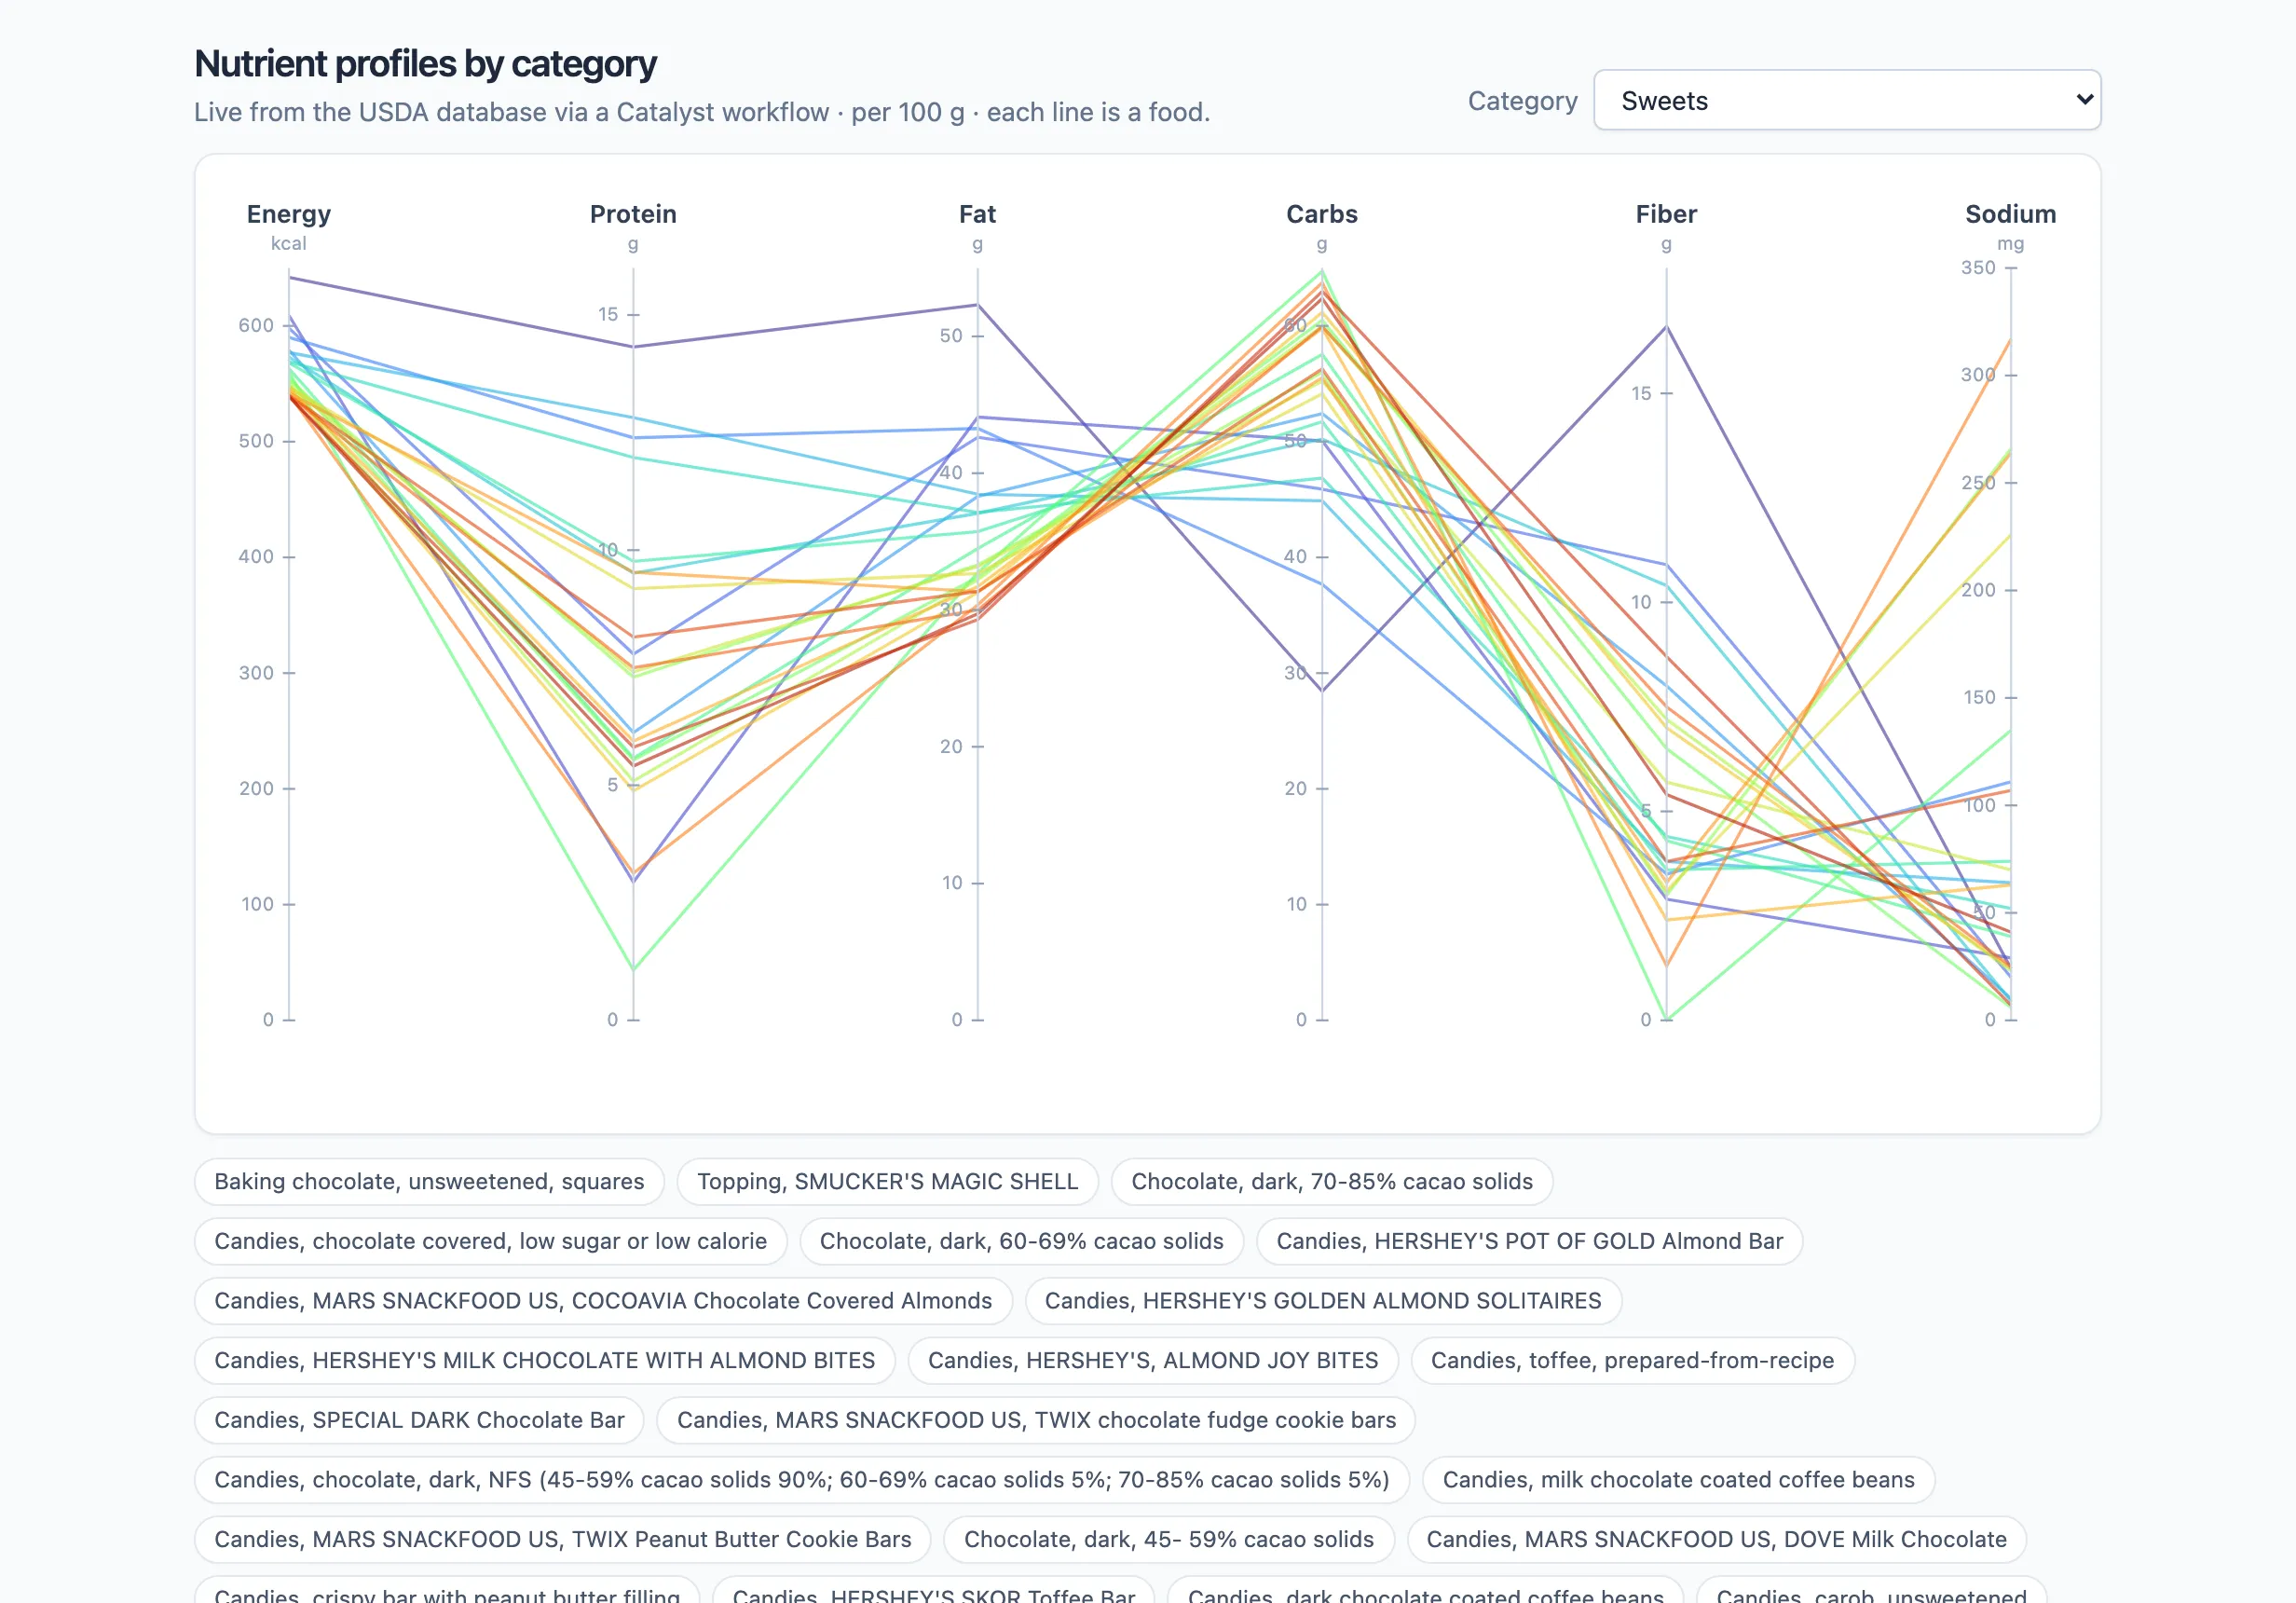
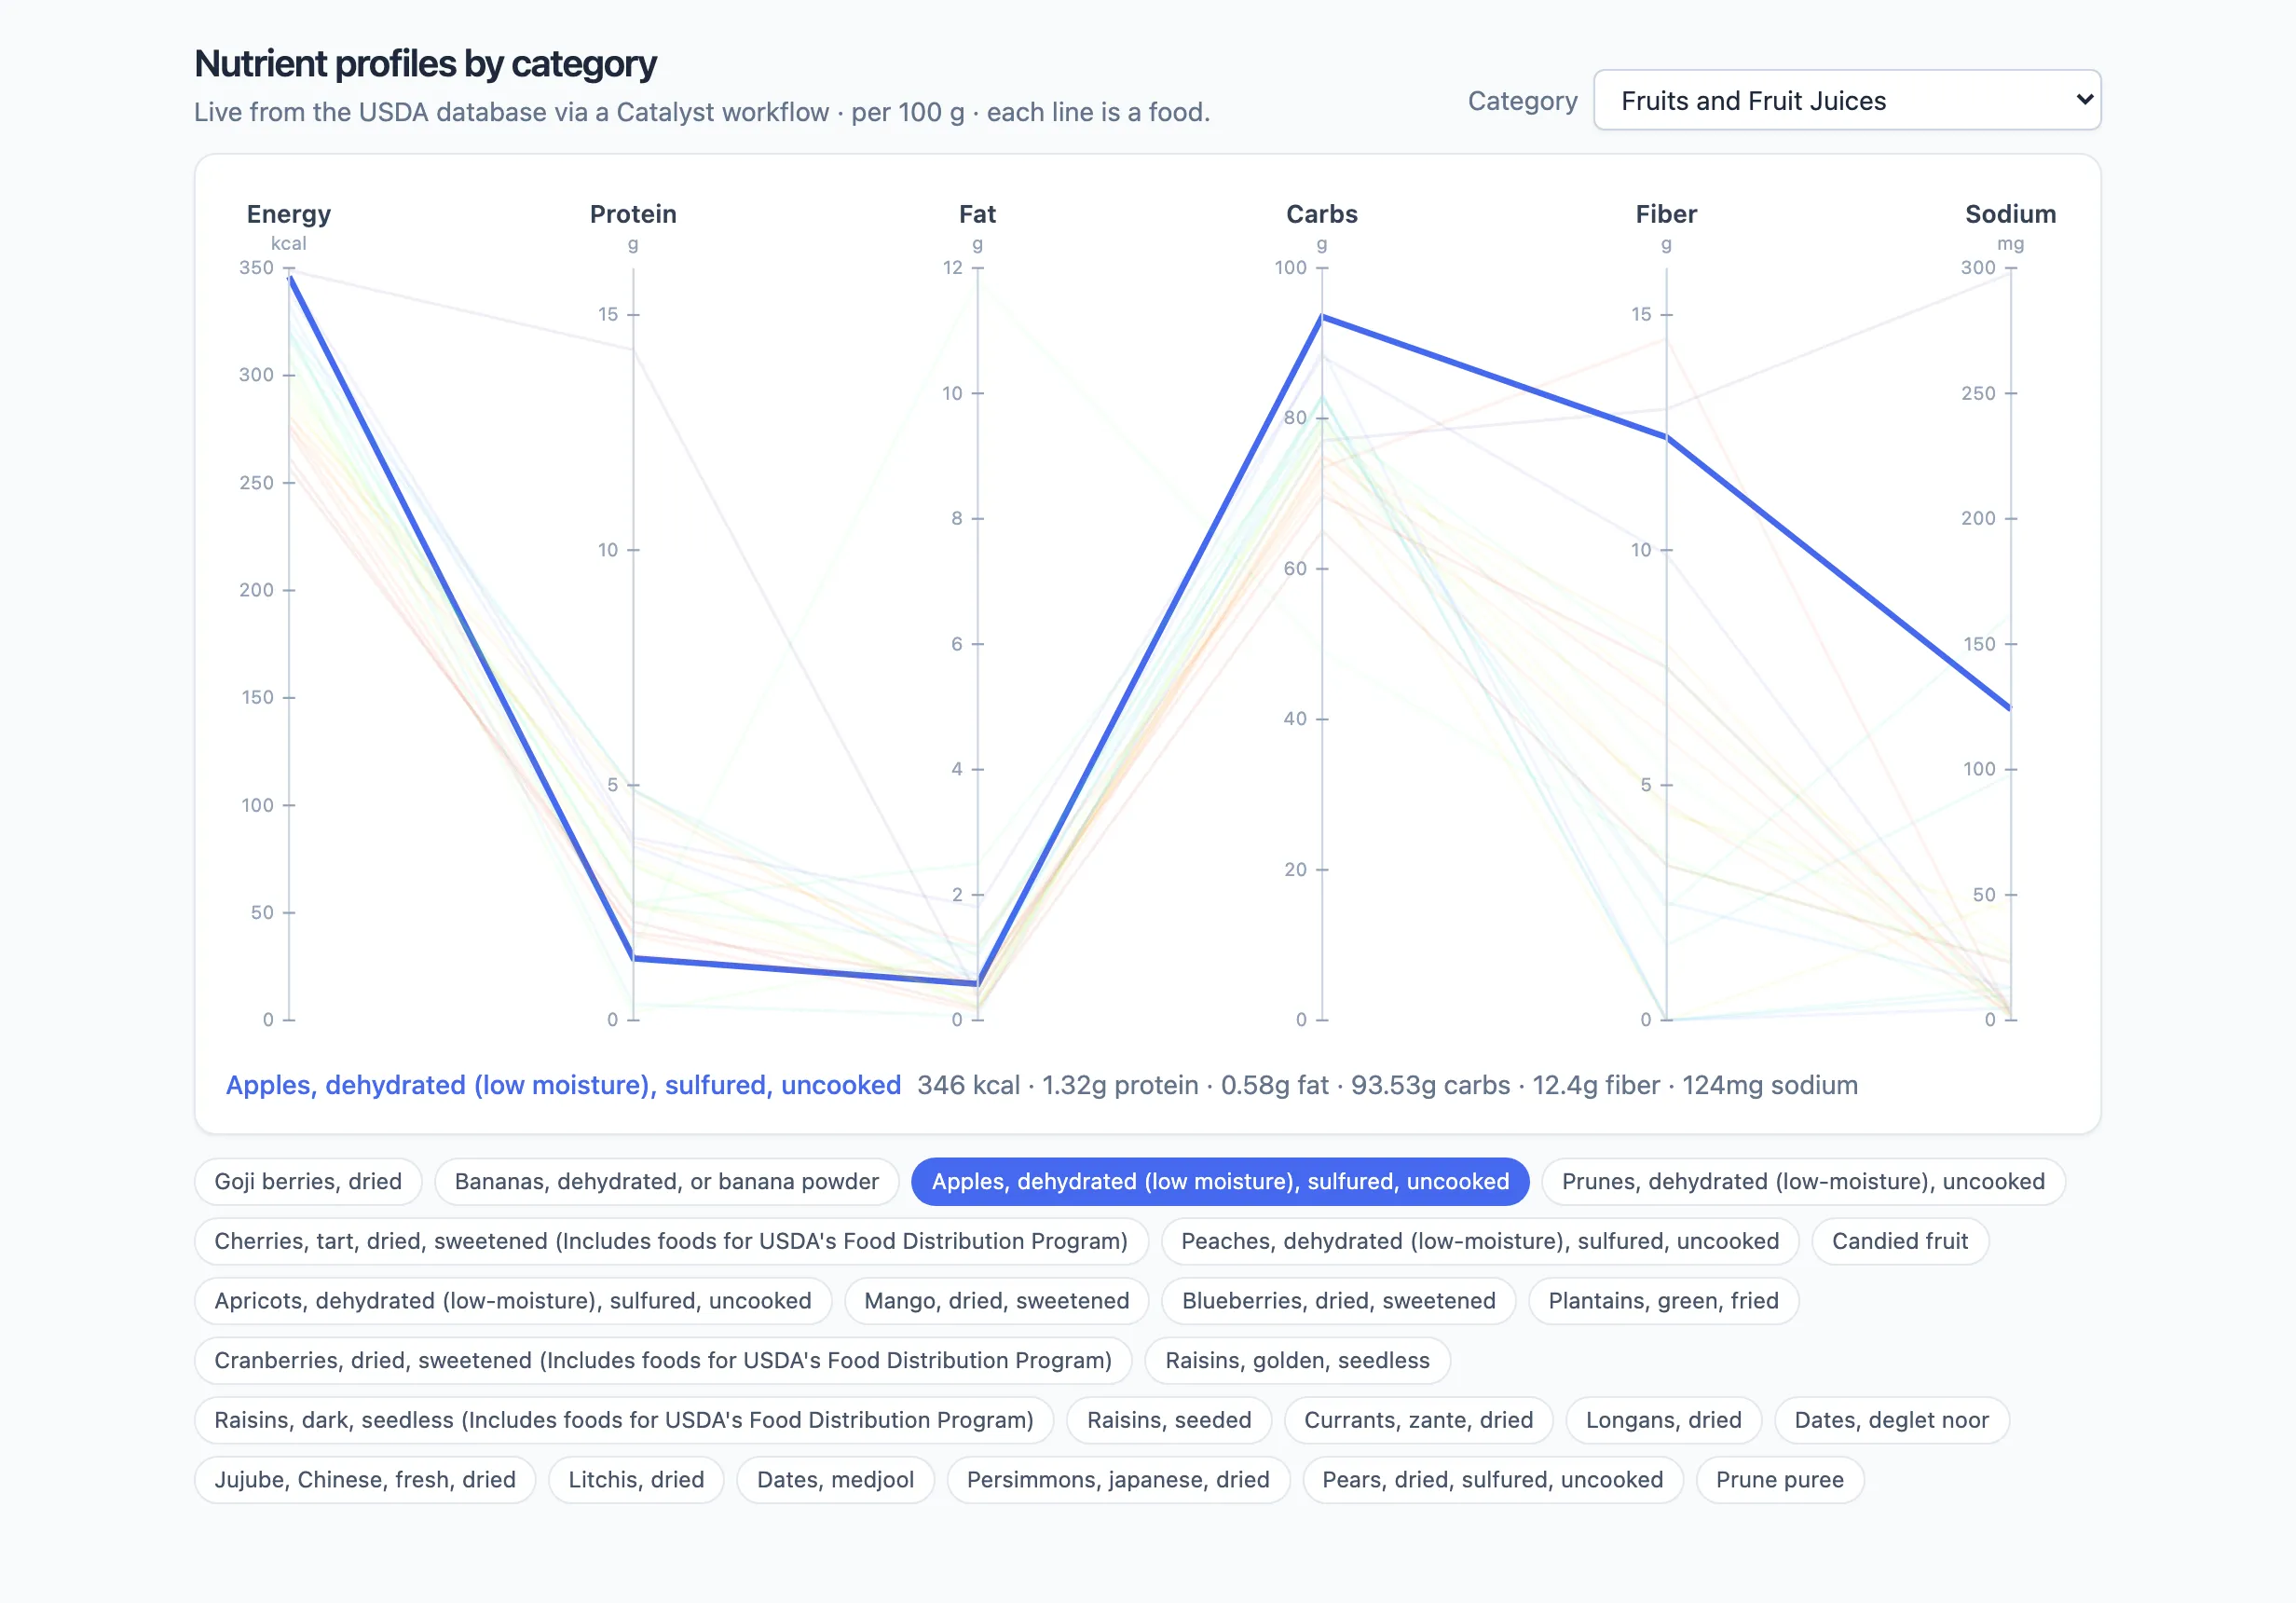
Each vertical axis is a nutrient; each line is a food threading through its values. Pick a different category and the app re-runs the workflow — here Fruits and Fruit Juices, a completely different set of foods, with one highlighted on hover:
From here it’s a normal app: save it, keep iterating in chat (“add a Calcium axis”, “sort the chips by calories”), and publish or share it.
The same workflow runs on a schedule just as happily as from an app. Swap the app for a delivery step — an LLM or Template node turning the rows into prose, then an email — and the database that powers your app also sends a weekly nutrition digest, hands-free.
Connect
Upload a SQLite/DuckDB file (or connect Postgres, MySQL, Oracle, SQL Server). Private, read-only, auto-limited.
Explore
Query it yourself in the SQL IDE, or just ask in chat and let the AI write the SQL.
Build
Wrap a query in a workflow with parameters — now the database is callable by a schedule, an app, or another workflow.
Visualize
Wire that workflow into an interactive app that pulls fresh data live, then share it.
One database, four surfaces — connect it once, and it’s available to your chats, your workflows, and your apps alike.