

Build your first workflow
This is a build-it-by-hand tutorial. We’ll make a small but real workflow: it takes a topic, has a model write a short executive brief on it, runs a little Python to tidy the result and count a few things, and returns the lot. Every screenshot below is the real editor doing exactly this. Once you’ve done it once, every other workflow is just more of the same.
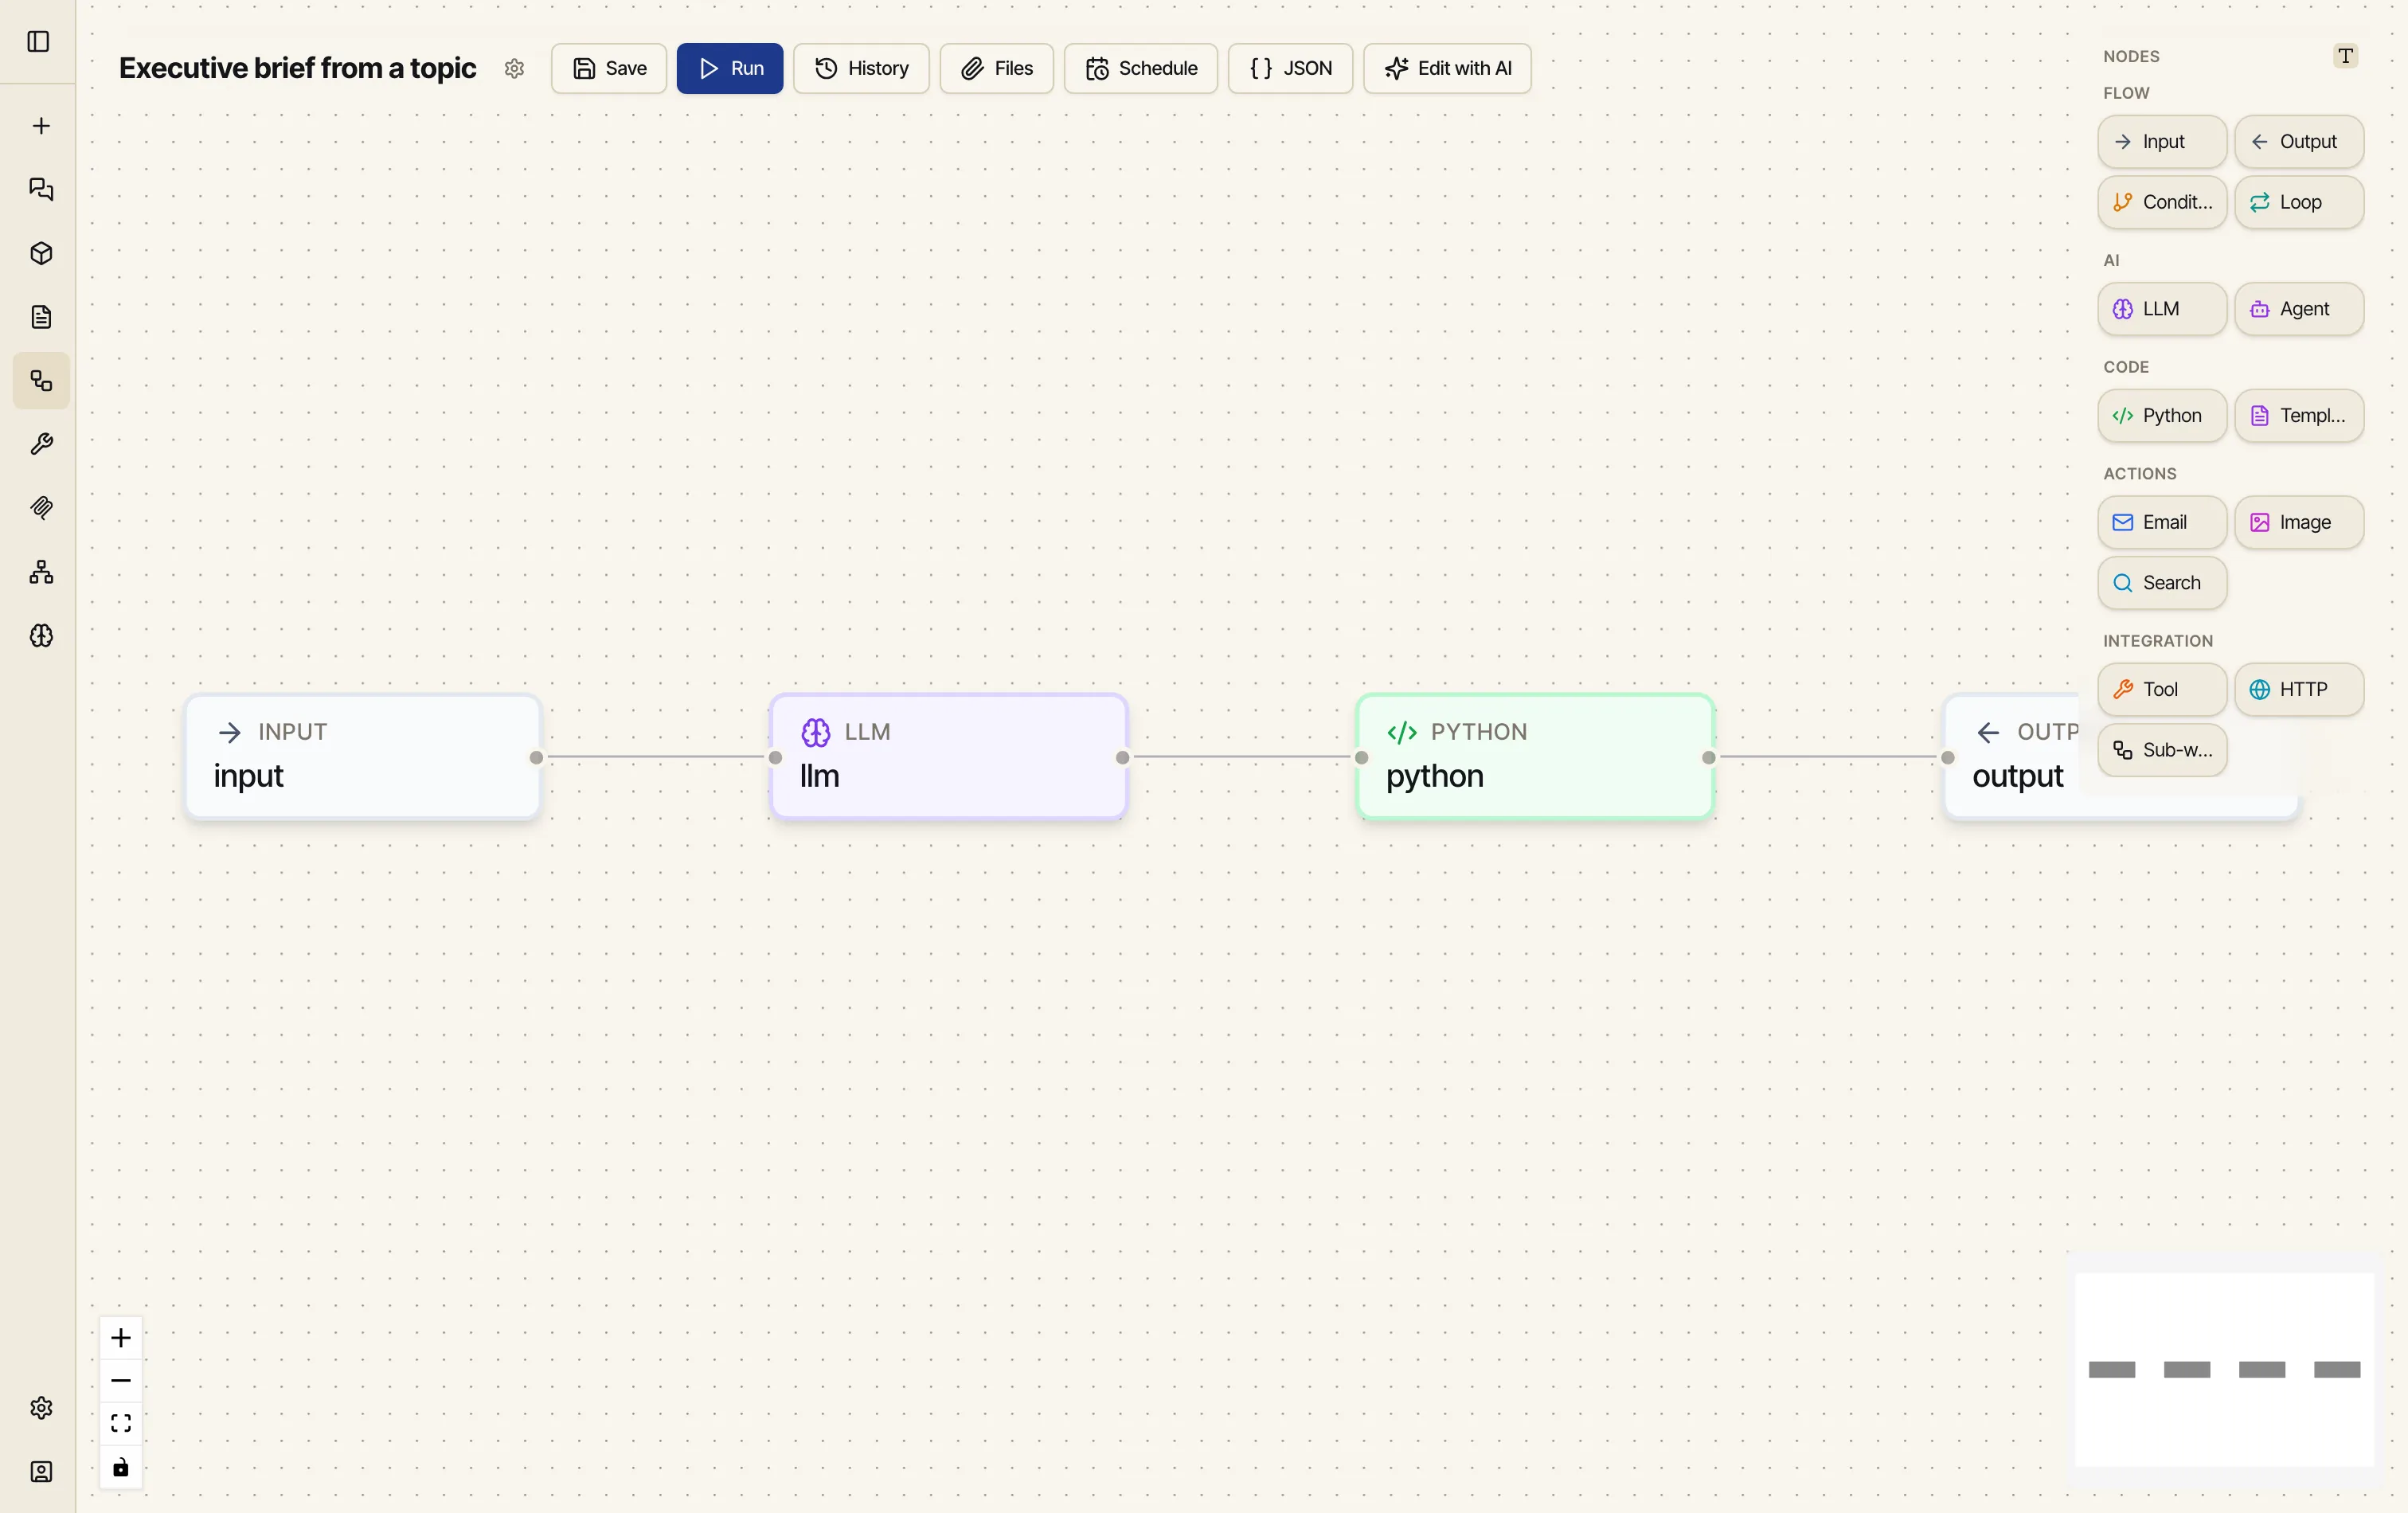
The editor at a glance
Section titled “The editor at a glance”Open Workflows from the sidebar and click New Workflow. You’ll see three regions:
- The canvas — the middle, where your nodes live and connect.
- The palette (right) — nodes grouped by what they do: Flow (Input, Output, Condition, Loop), AI (LLM, Agent), Code (Python, Template), Actions (Email, Image, Search), and Integration (Tool, HTTP, Sub-workflow).
- The toolbar (top) — Save, Run, History, Files, Schedule, JSON, and Edit with AI. The workflow’s name sits at the far left — click it to rename.
You add a node by dragging it from the palette onto the canvas.
Build it
Section titled “Build it”-
Name it. Click the title (it starts as Untitled Workflow) and call it something like
Executive brief from a topic. -
Add an Input node. Drag Input onto the canvas, click it to open the Properties panel on the right, and add a parameter called
topicof typestring. This is the value you’ll supply each run. (If a parameter should only take one of a few values, list them in its Options field, comma-separated — the Run dialog then shows a dropdown instead of a text box.)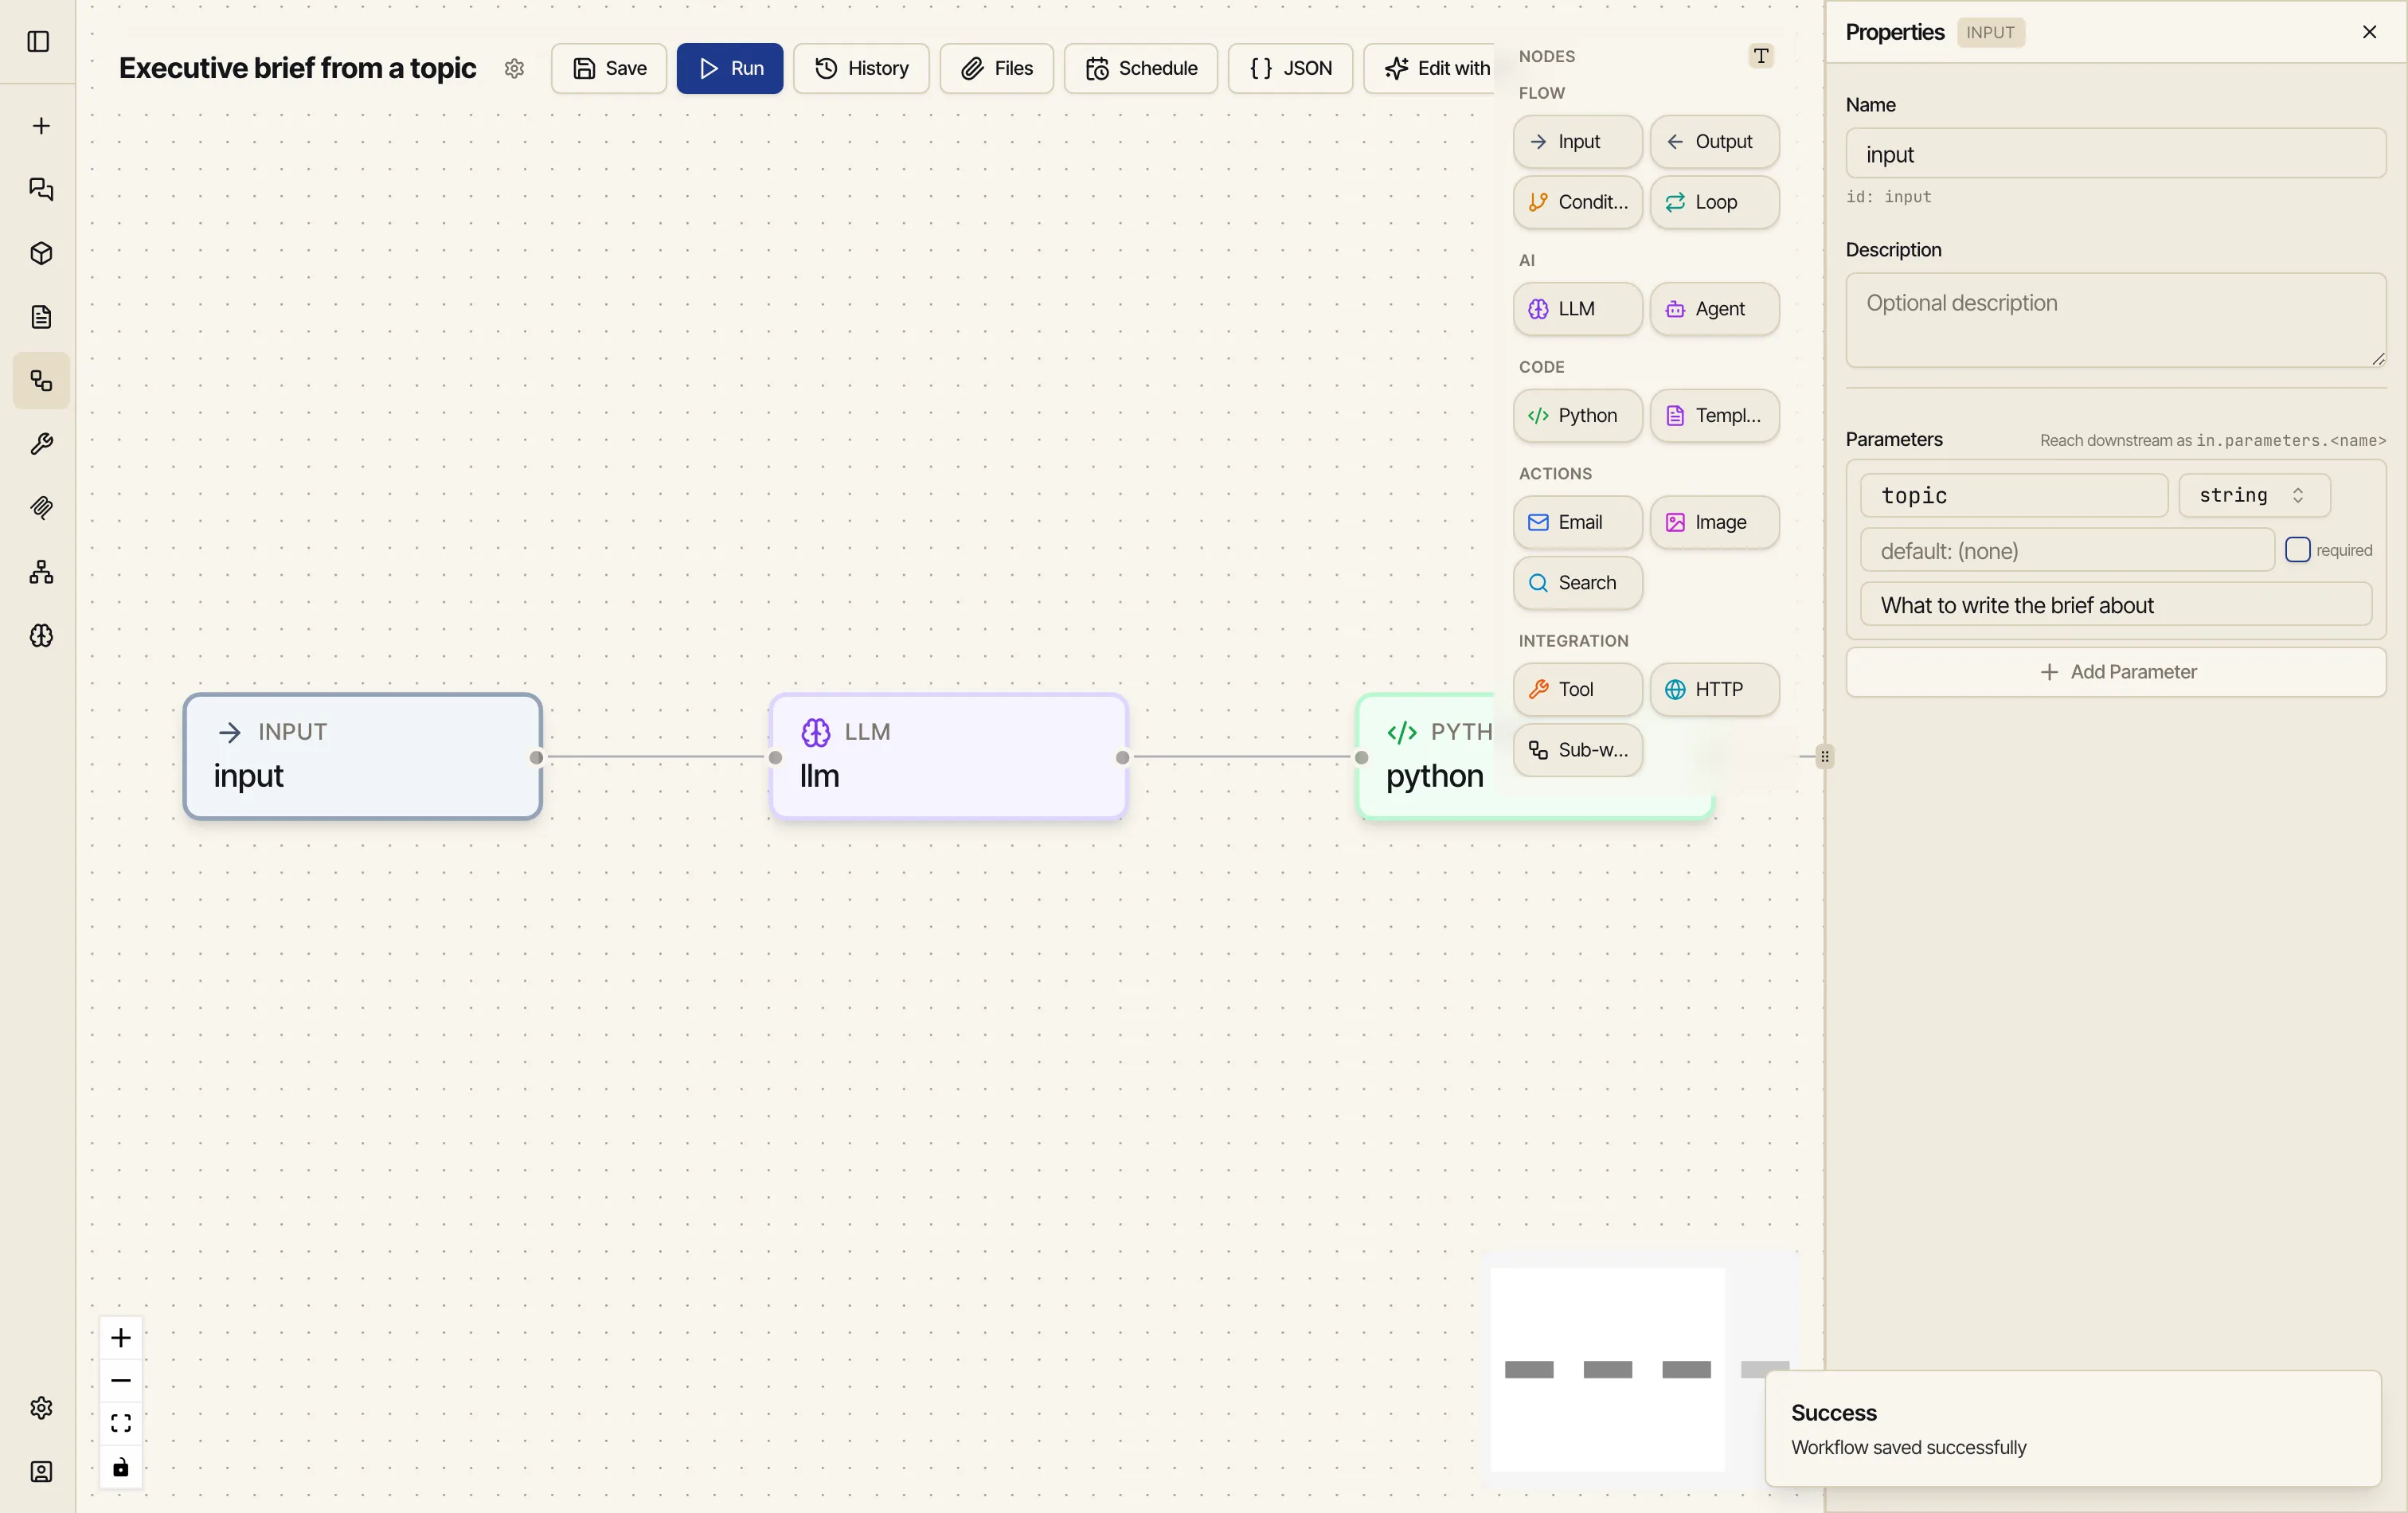
-
Add an LLM node. Drag LLM on. In Properties, pick a Model (here,
claude-opus-4-8) and write the prompt on the Prompt tab. Refer to the input by name:Write a tight 5-bullet executive brief on {{ input.parameters.topic }}.One bullet per line. Start each line with "- ". No preamble, no closing line.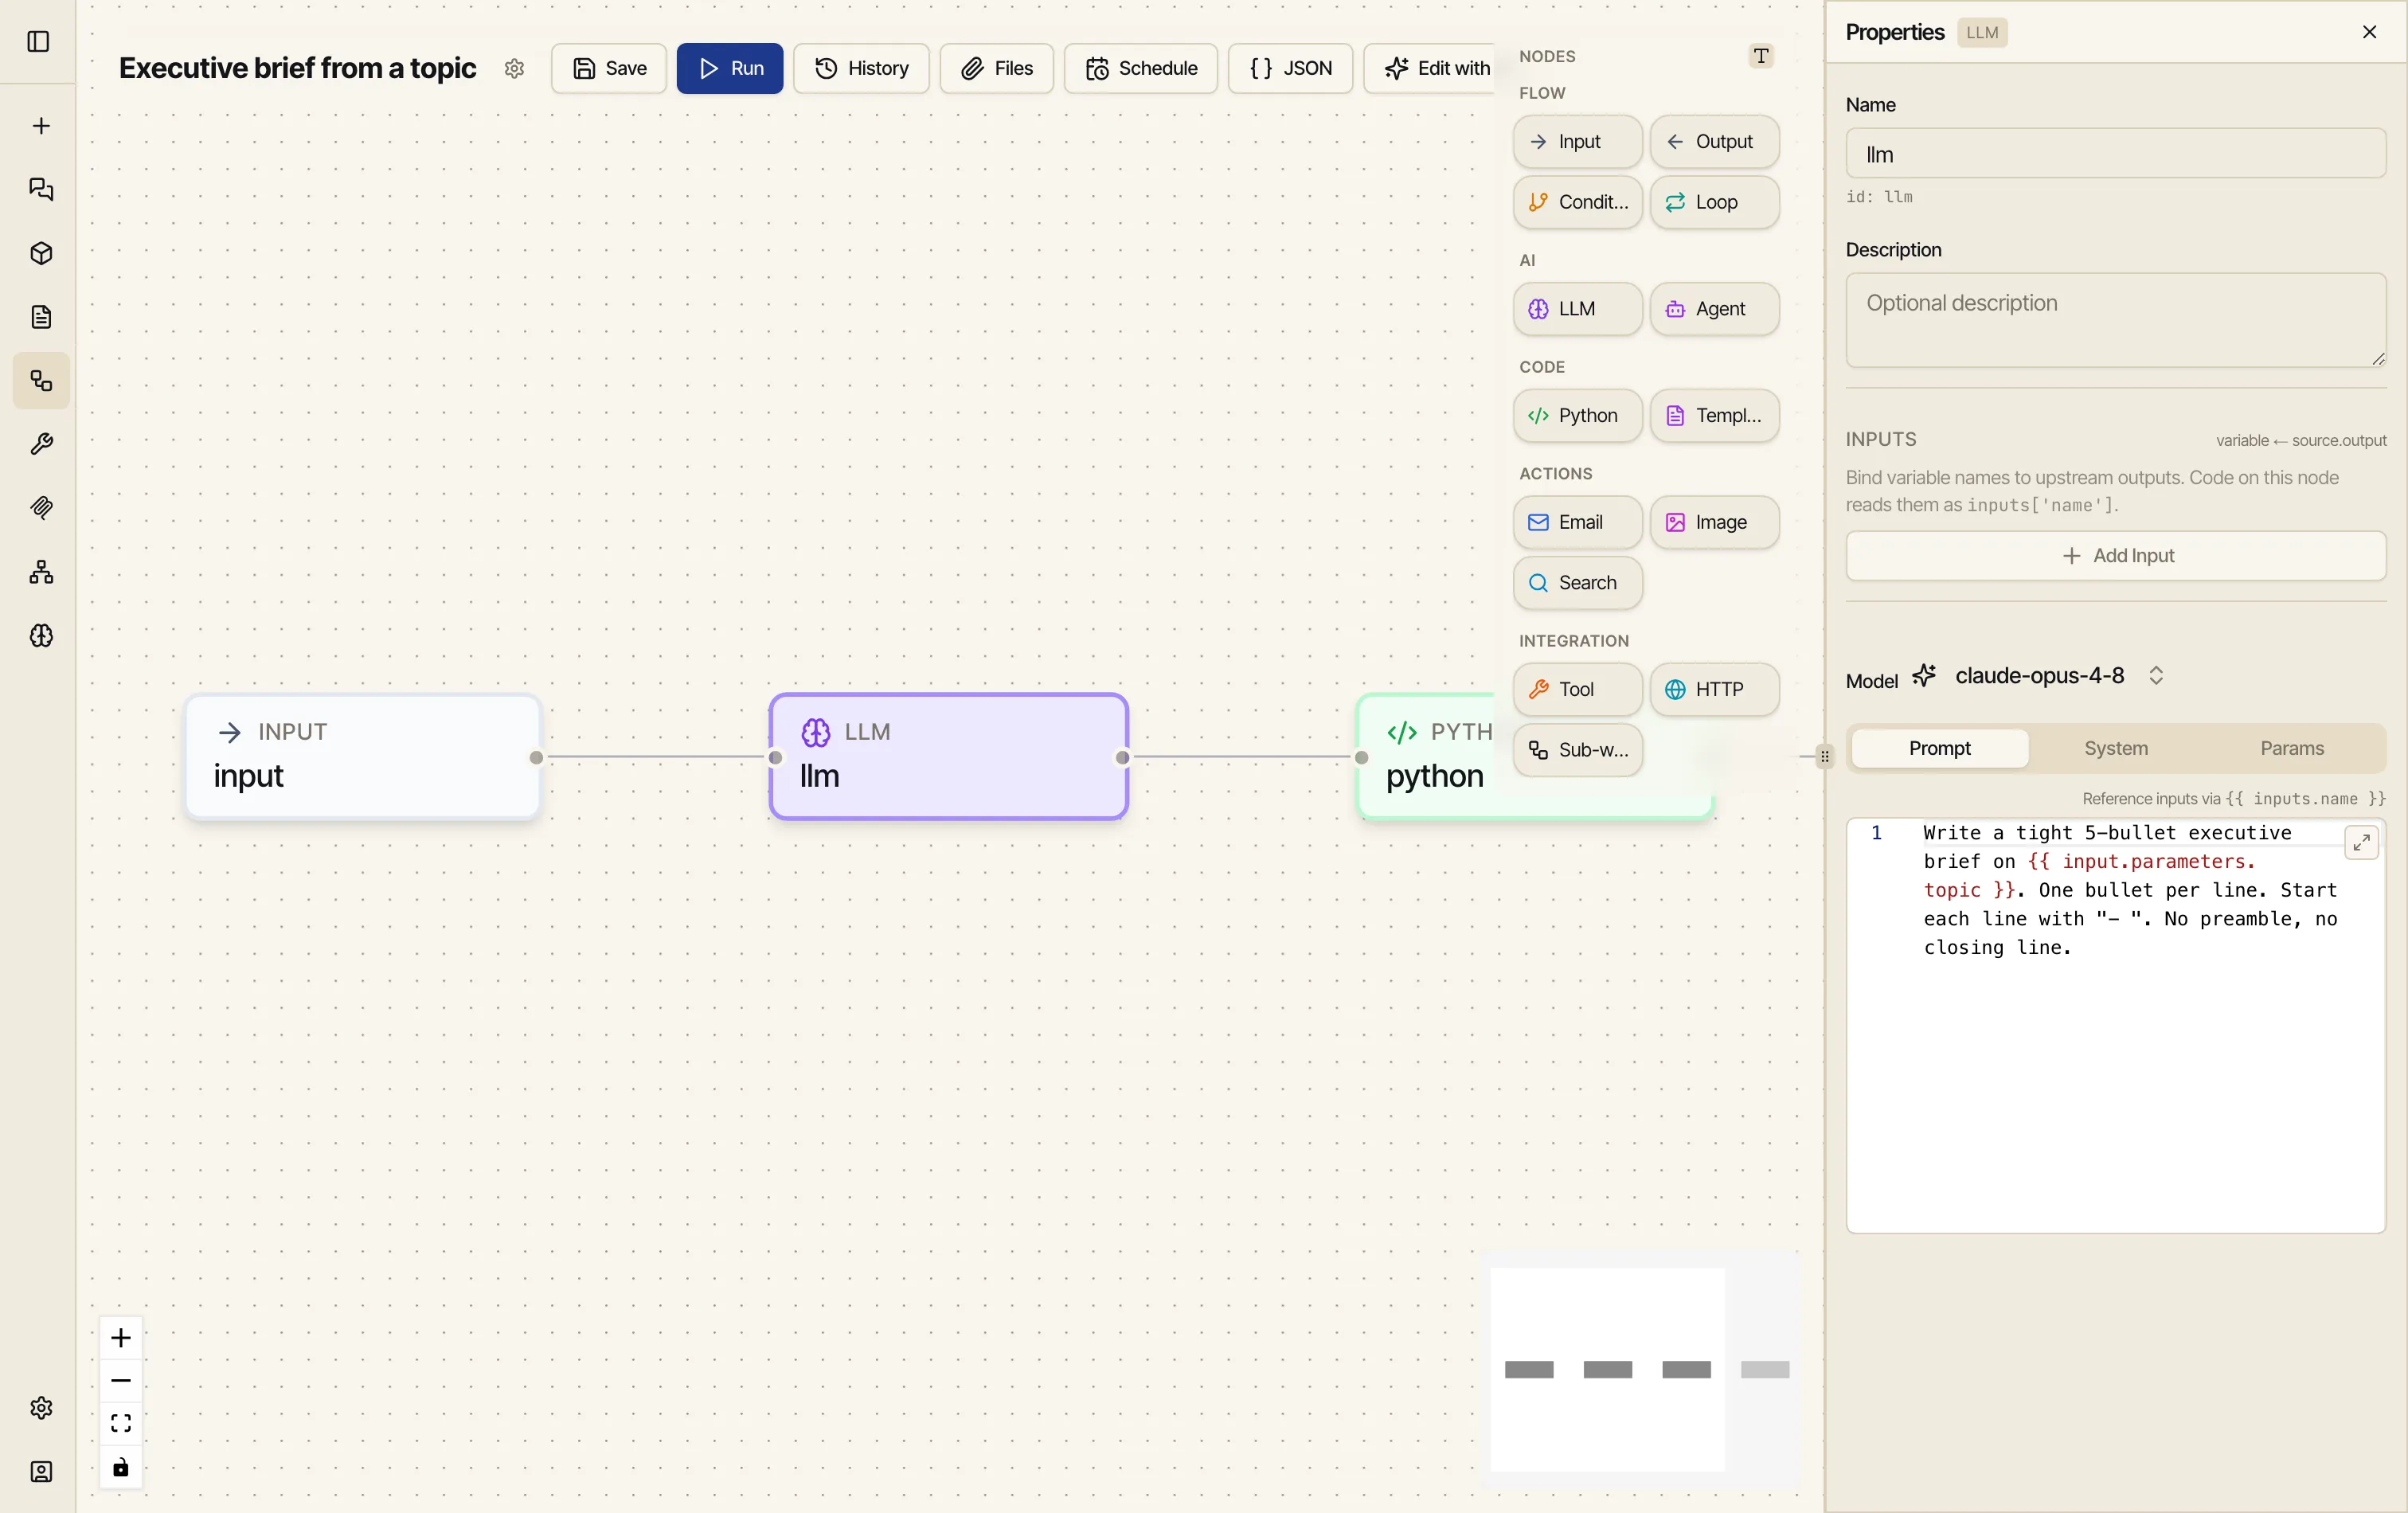
That
{{ input.parameters.topic }}reference is how you wire nodes together — Catalyst sees it and knows the Input node has to run first. (More on references below.) -
Add a Python node. Drag Python on and paste this into its code field. The LLM node’s answer arrives as
inputs["text"]; this turns the bullets into a numbered list and counts a couple of things:# The LLM node's output arrives over the edge as inputs["text"].# Turn the bullet list into a numbered list and count a few things.brief = inputs.get("text", "")bullets = [line.lstrip("- ").strip() for line in brief.splitlines() if line.strip()]result = {"bullet_count": len(bullets),"word_count": len(brief.split()),"numbered": "\n".join(f"{i + 1}. {b}" for i, b in enumerate(bullets)),}![The Python node's code editor maximised, showing the code that reads inputs['text'], splits it into bullets, and builds a result dict with bullet_count, word_count and a numbered string.](/_astro/workflow-build-python.D7L6AFXj_1pUcY0.webp)
Two rules for Python nodes: read your inputs from the
inputsdict, and assign your answer to a variable calledresult. Whateverresultholds is what the node outputs. -
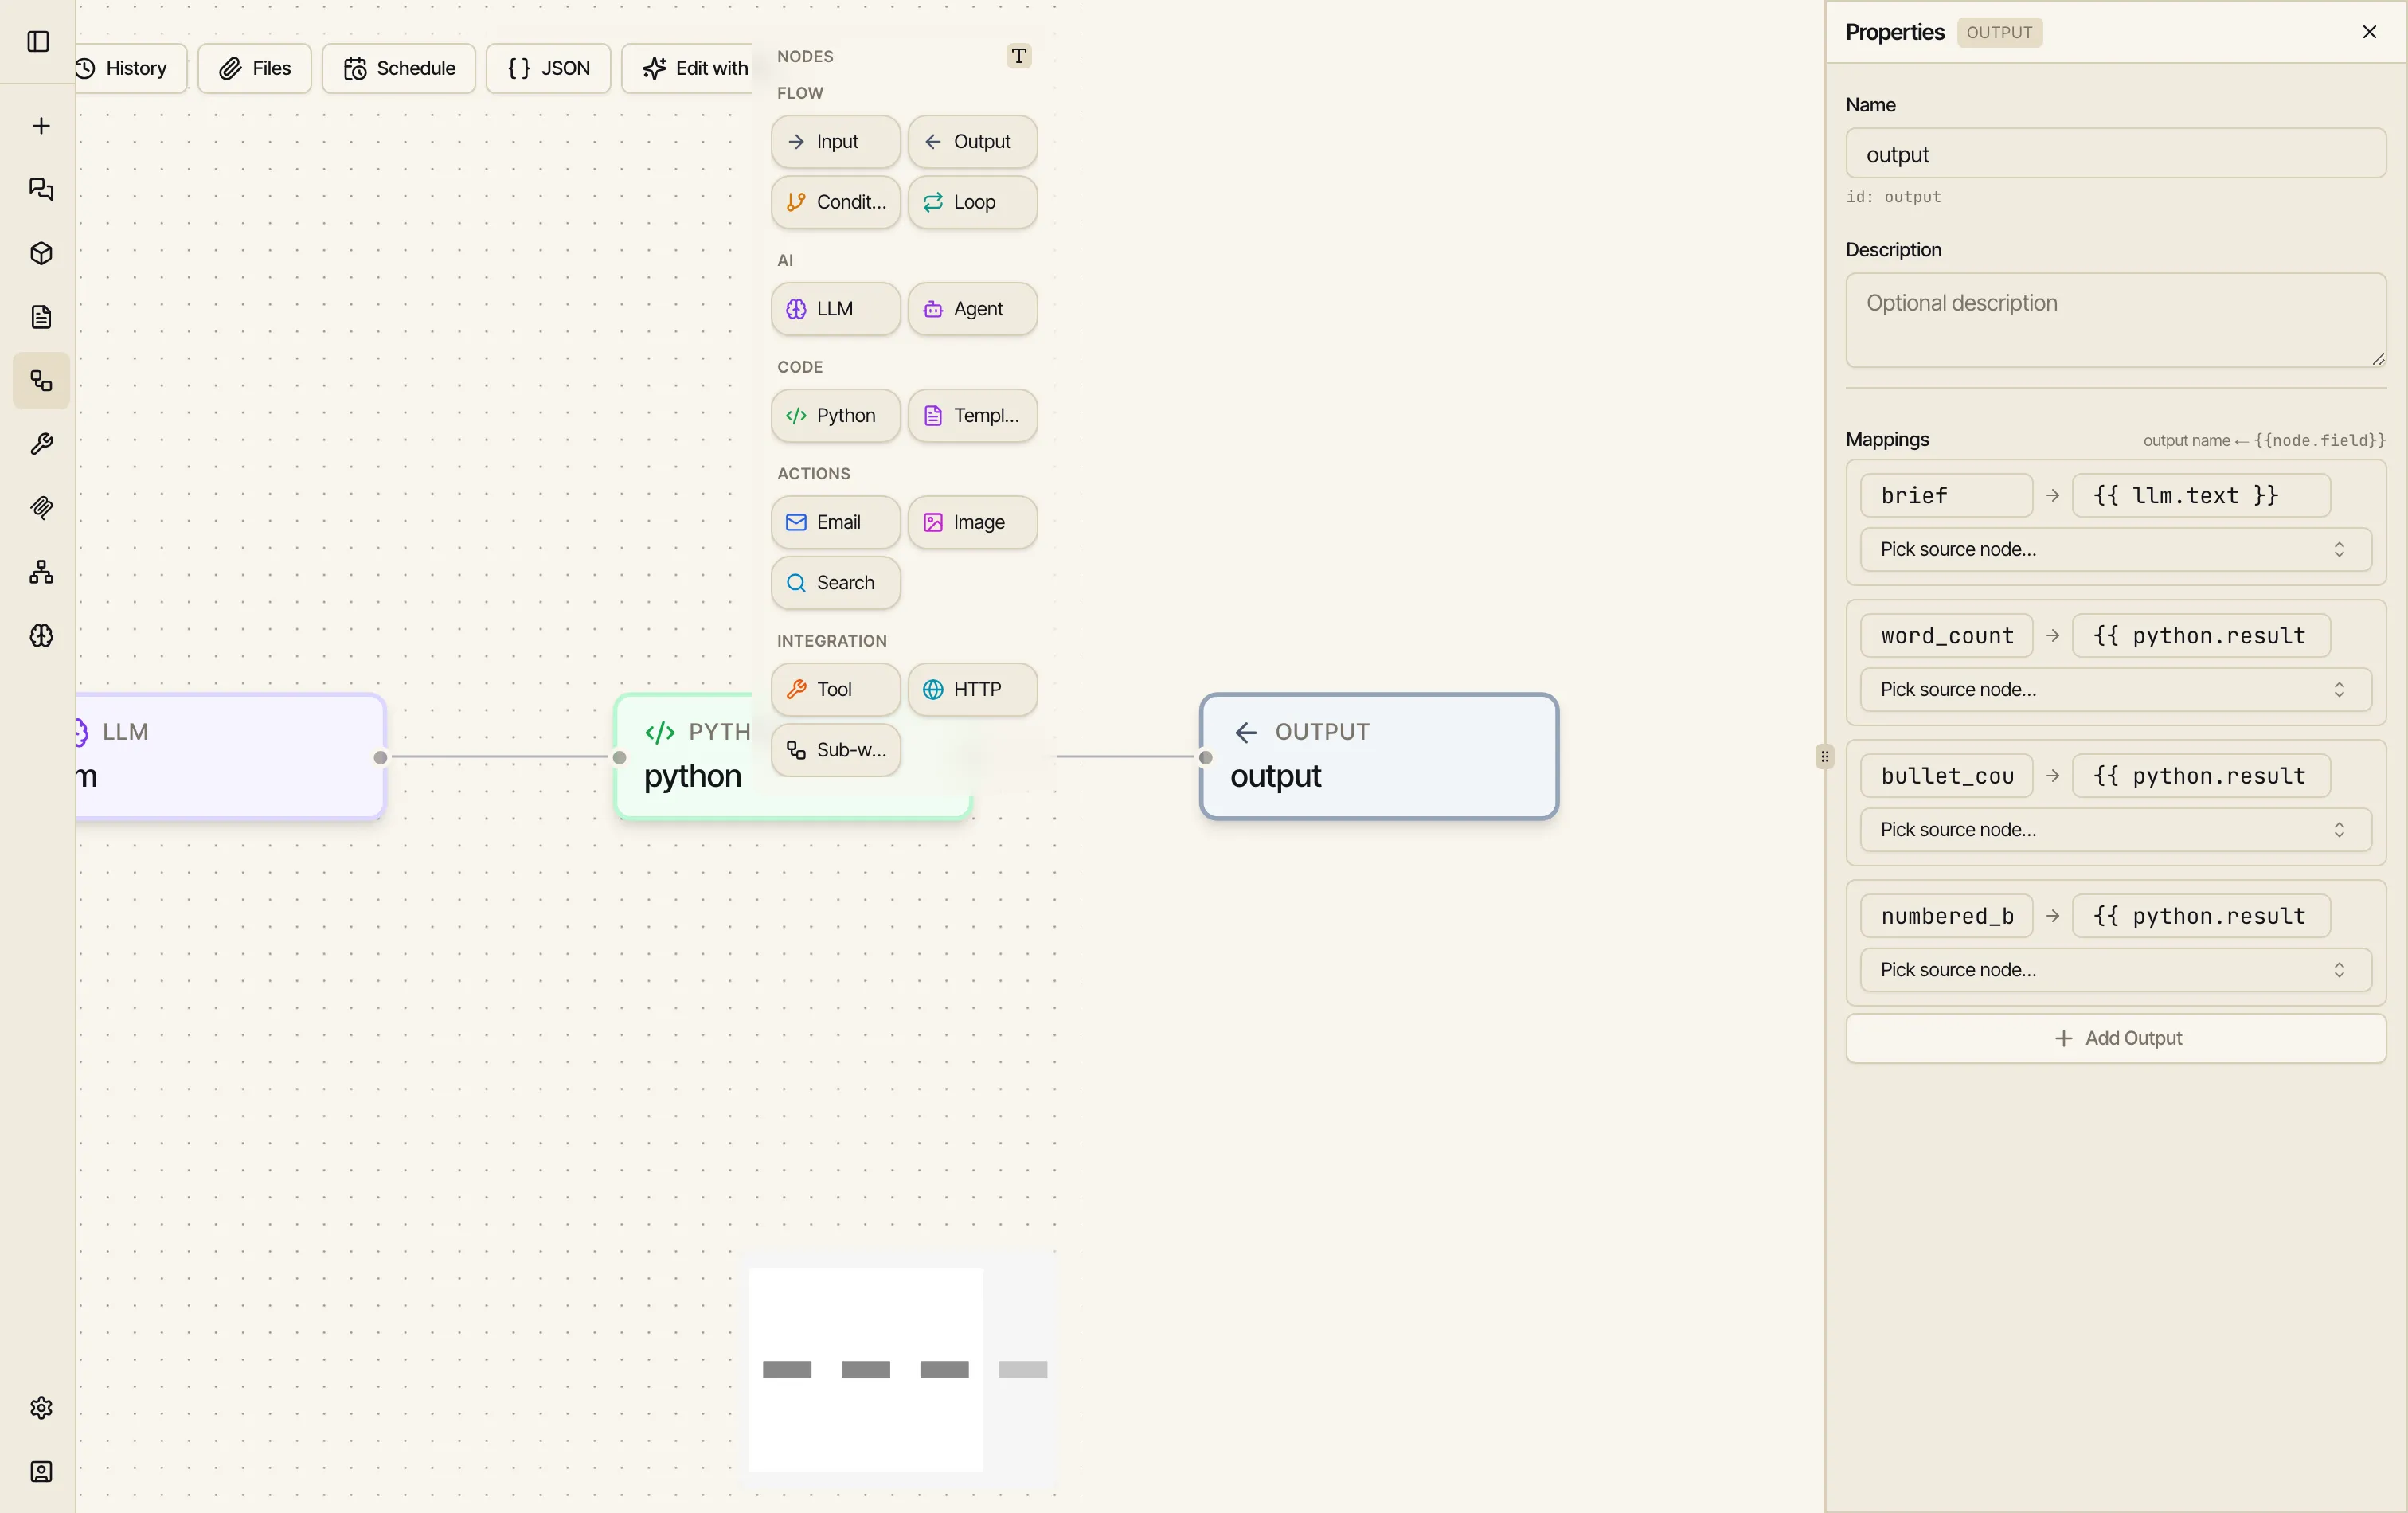
Add an Output node. Drag Output on. In Properties, map the fields you want the run to return to the upstream values that produce them:
brief→{{ llm.text }}numbered_brief→{{ python.result.numbered }}bullet_count→{{ python.result.bullet_count }}word_count→{{ python.result.word_count }}
-
Connect the nodes. Drag from the dot on the right edge of one node to the dot on the left edge of the next, in order: input → llm → python → output. The lines you draw set the run order; the
{{ … }}references decide what data flows where.
Run it
Section titled “Run it”-
Click Run. Because the workflow declares a
topicparameter, Catalyst asks for it first.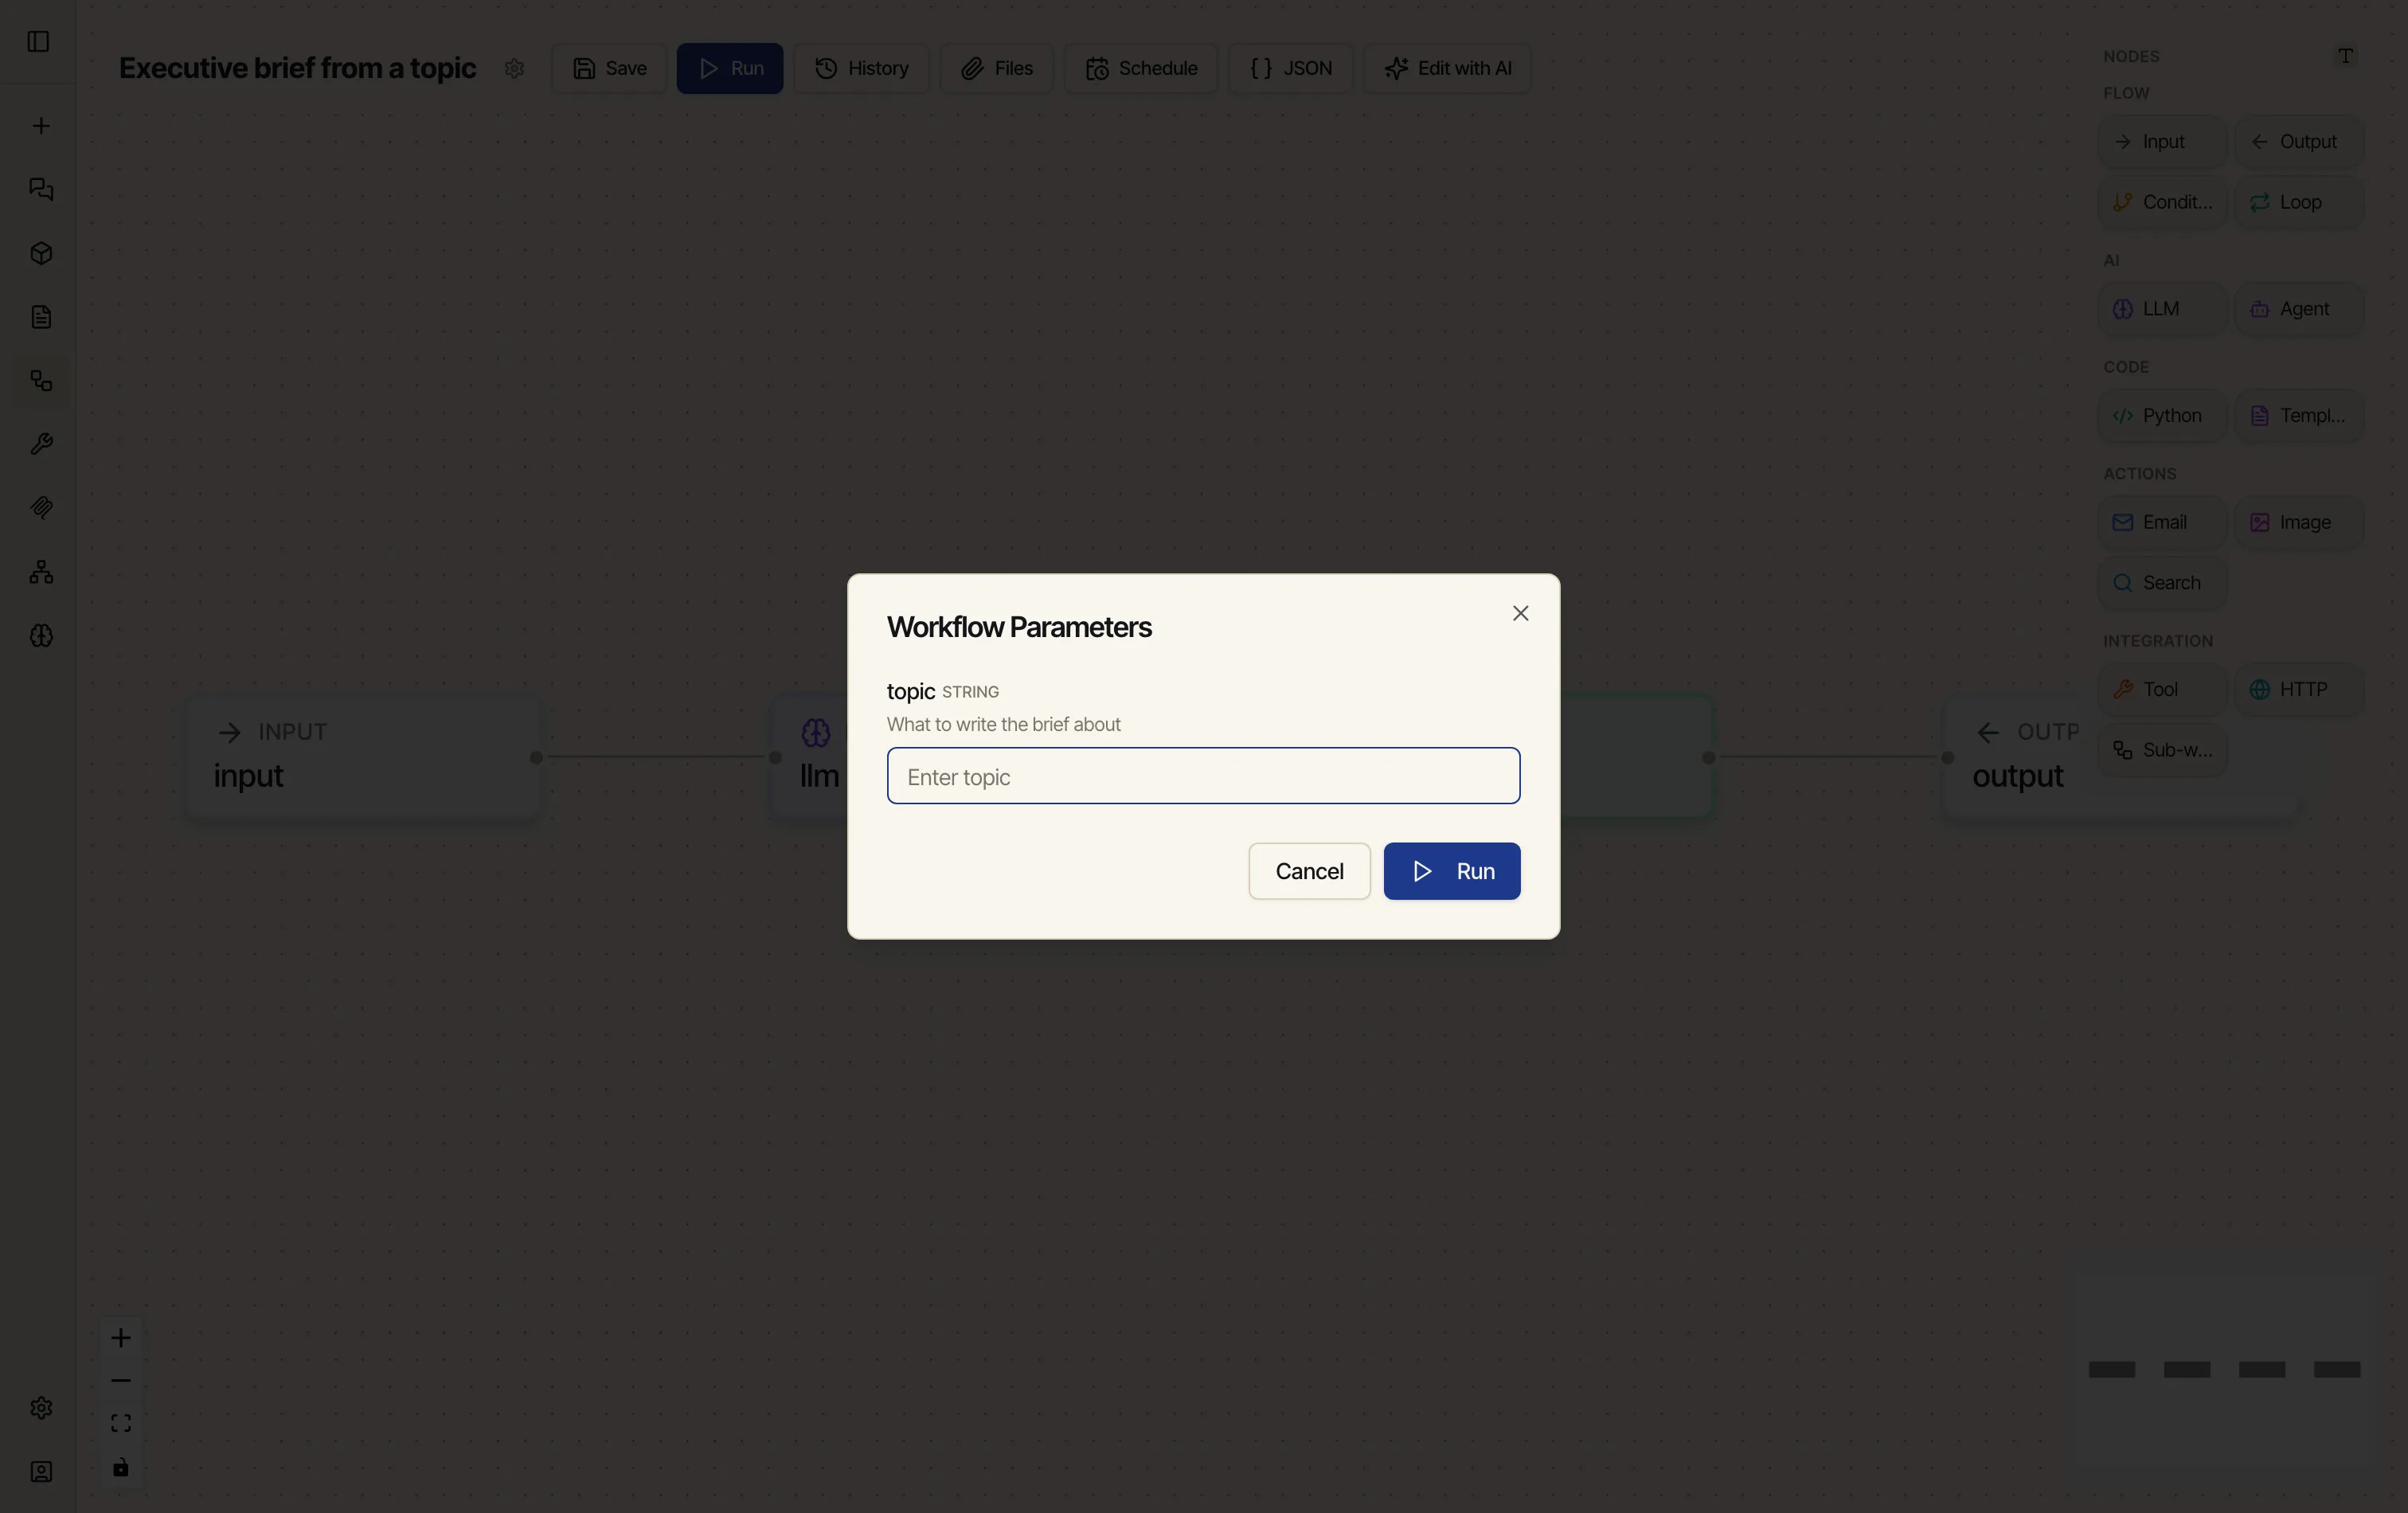
-
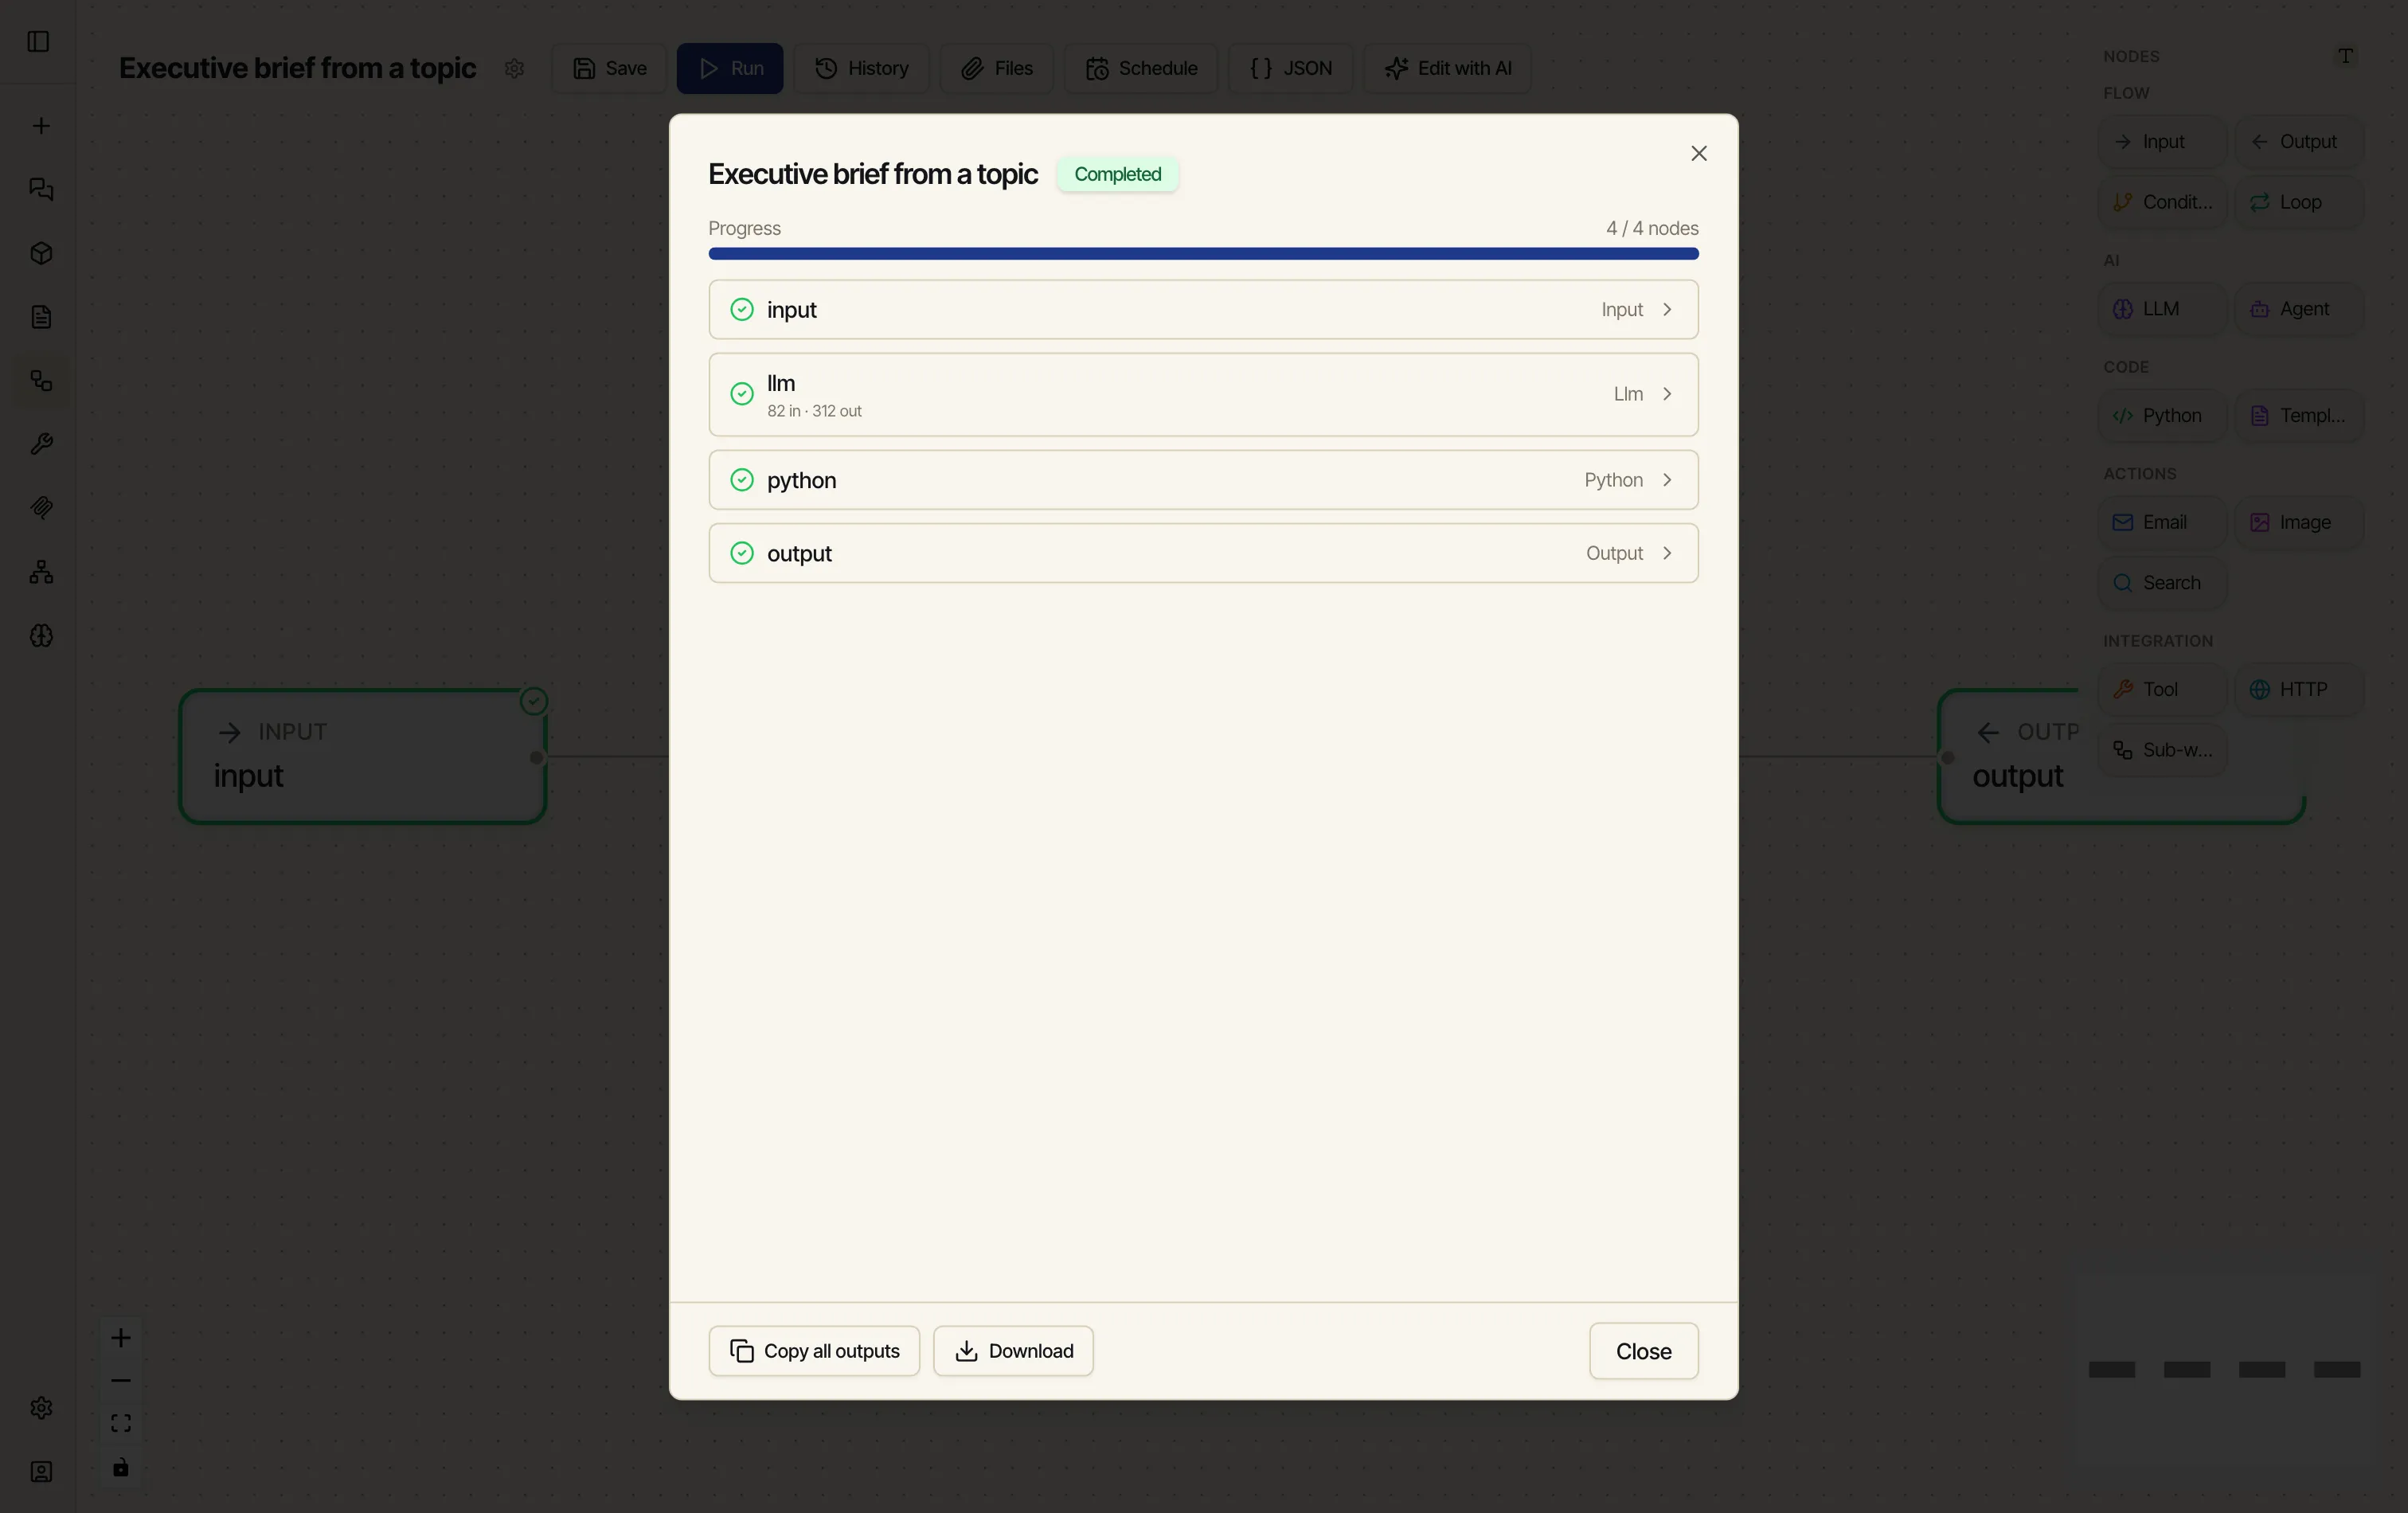
Type a topic and click Run. The runner opens and each node lights up as it executes — green when it’s done. When everything’s finished you’ll see Completed and 4 / 4 nodes.
-
Click any node row to see what it produced. The output node shows the final result — the brief, the numbered version, and the counts.
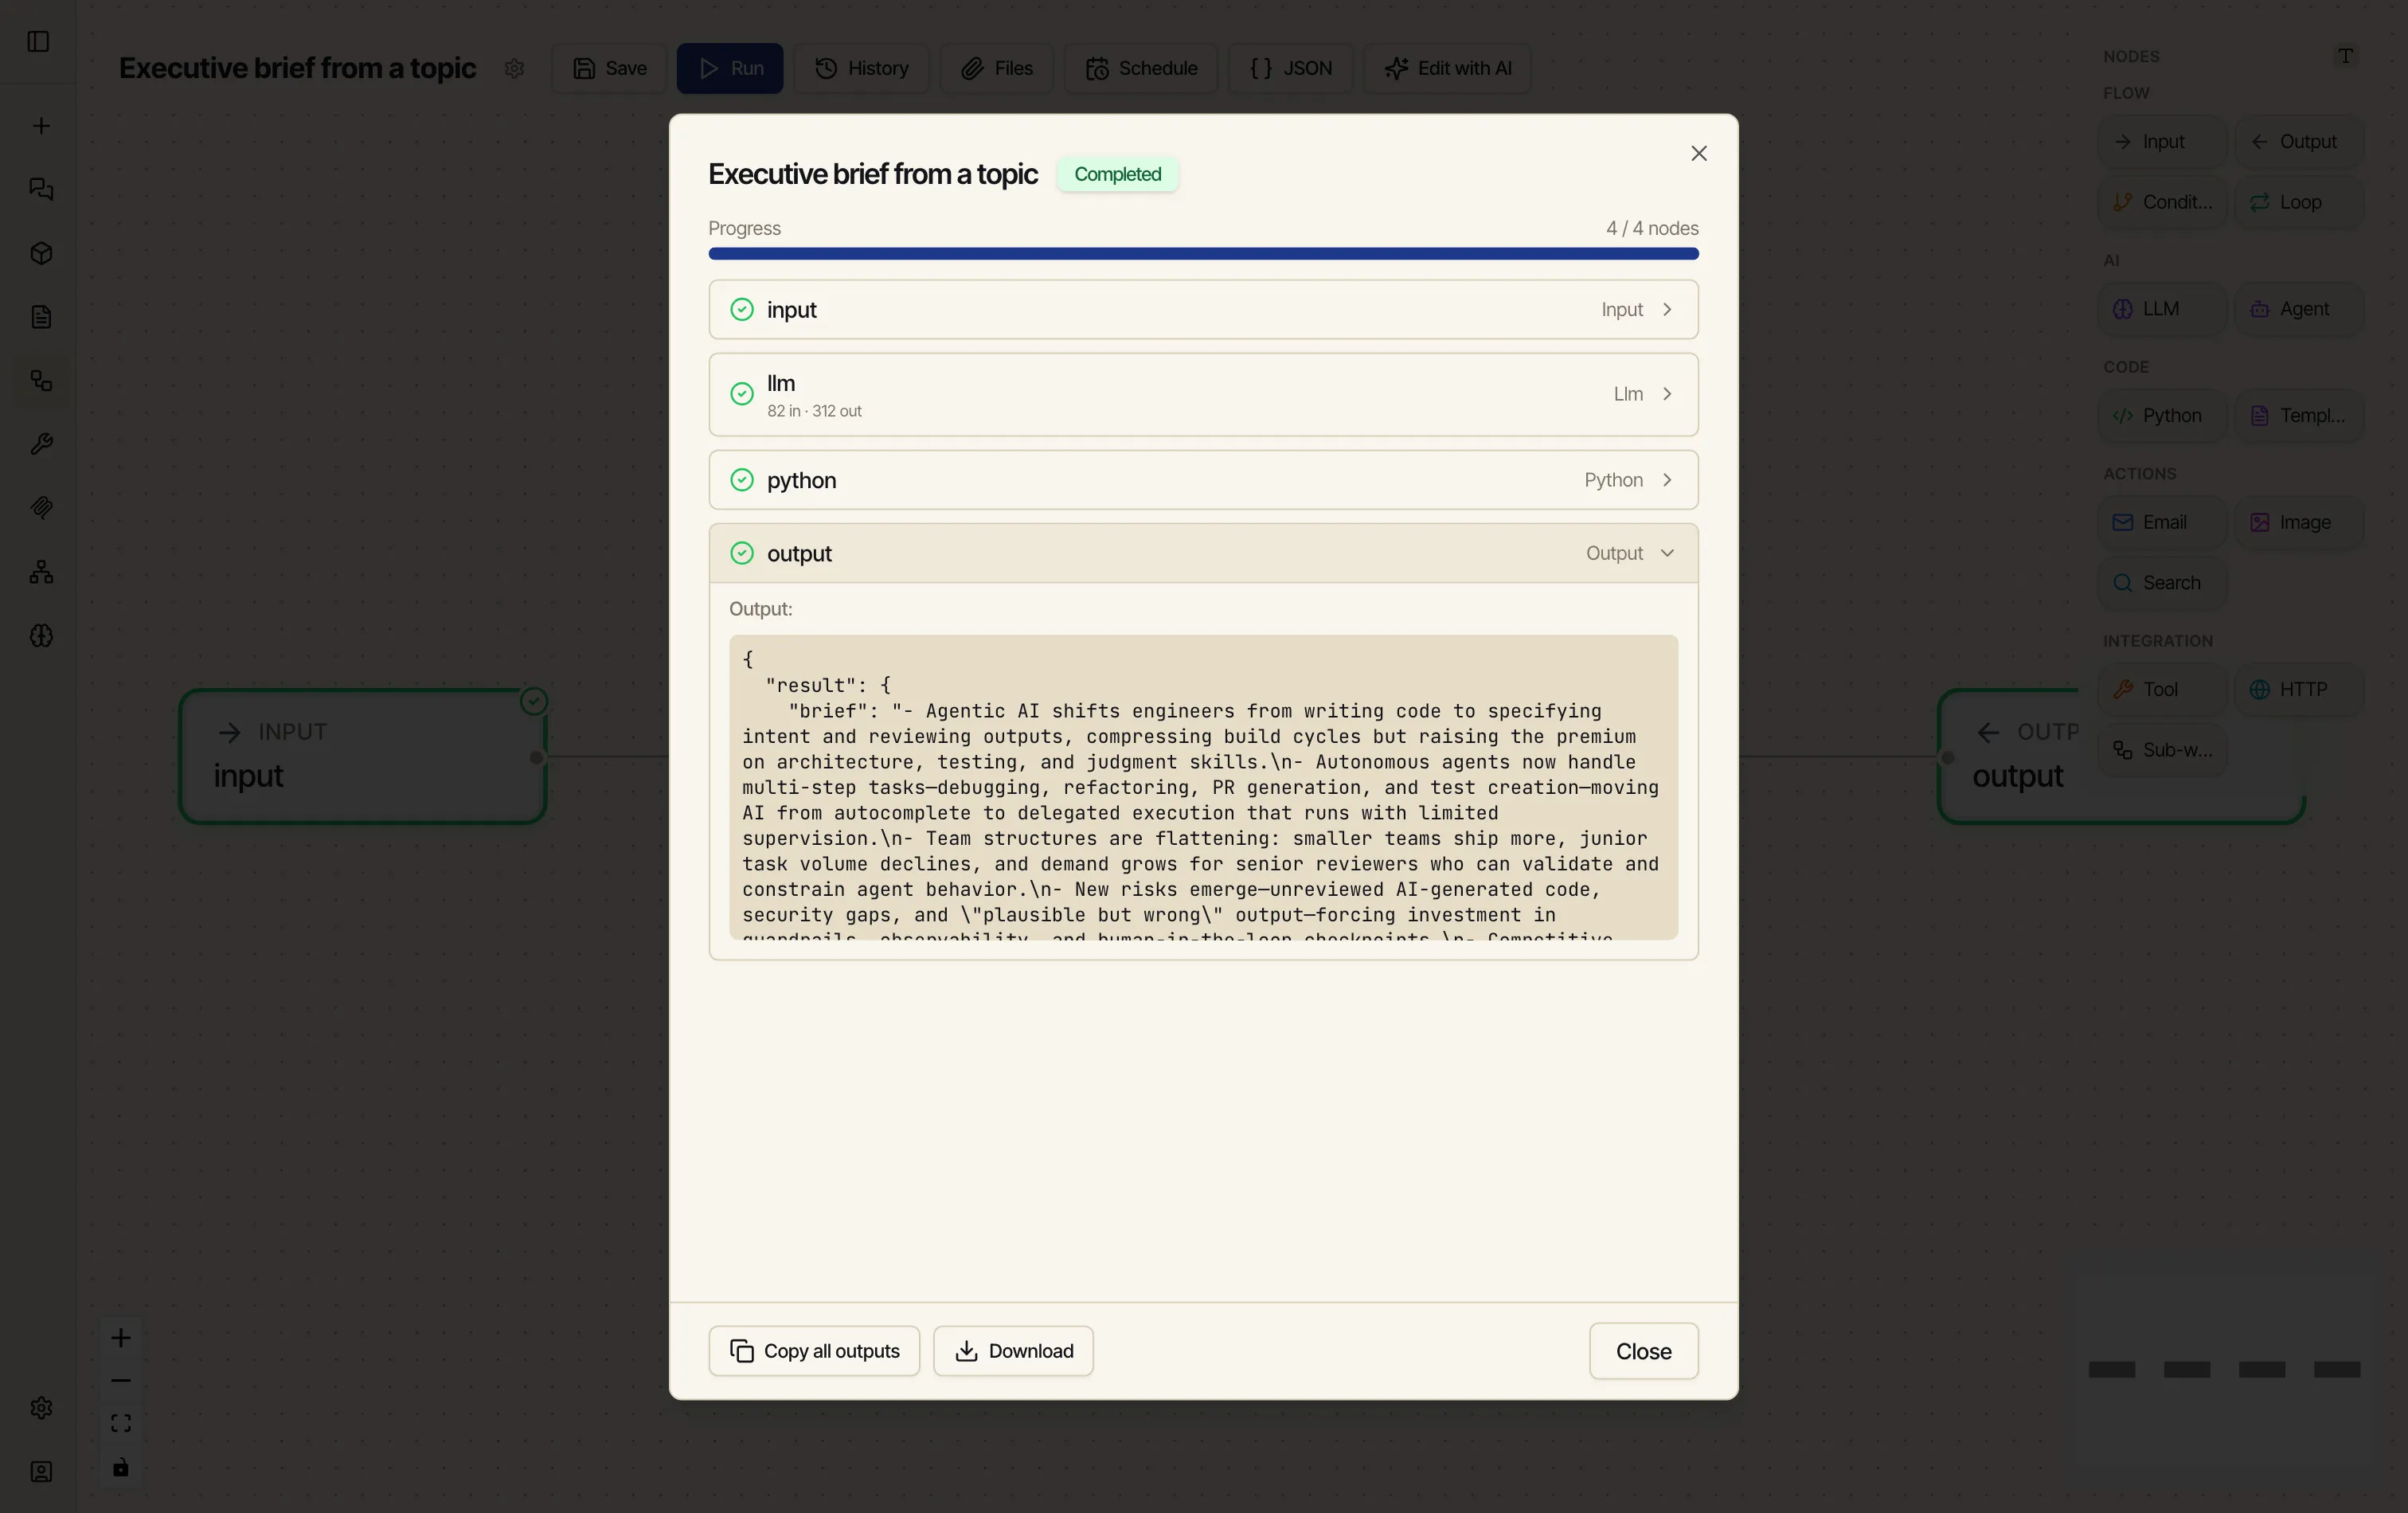
Here’s the whole run, start to finish:
Save it
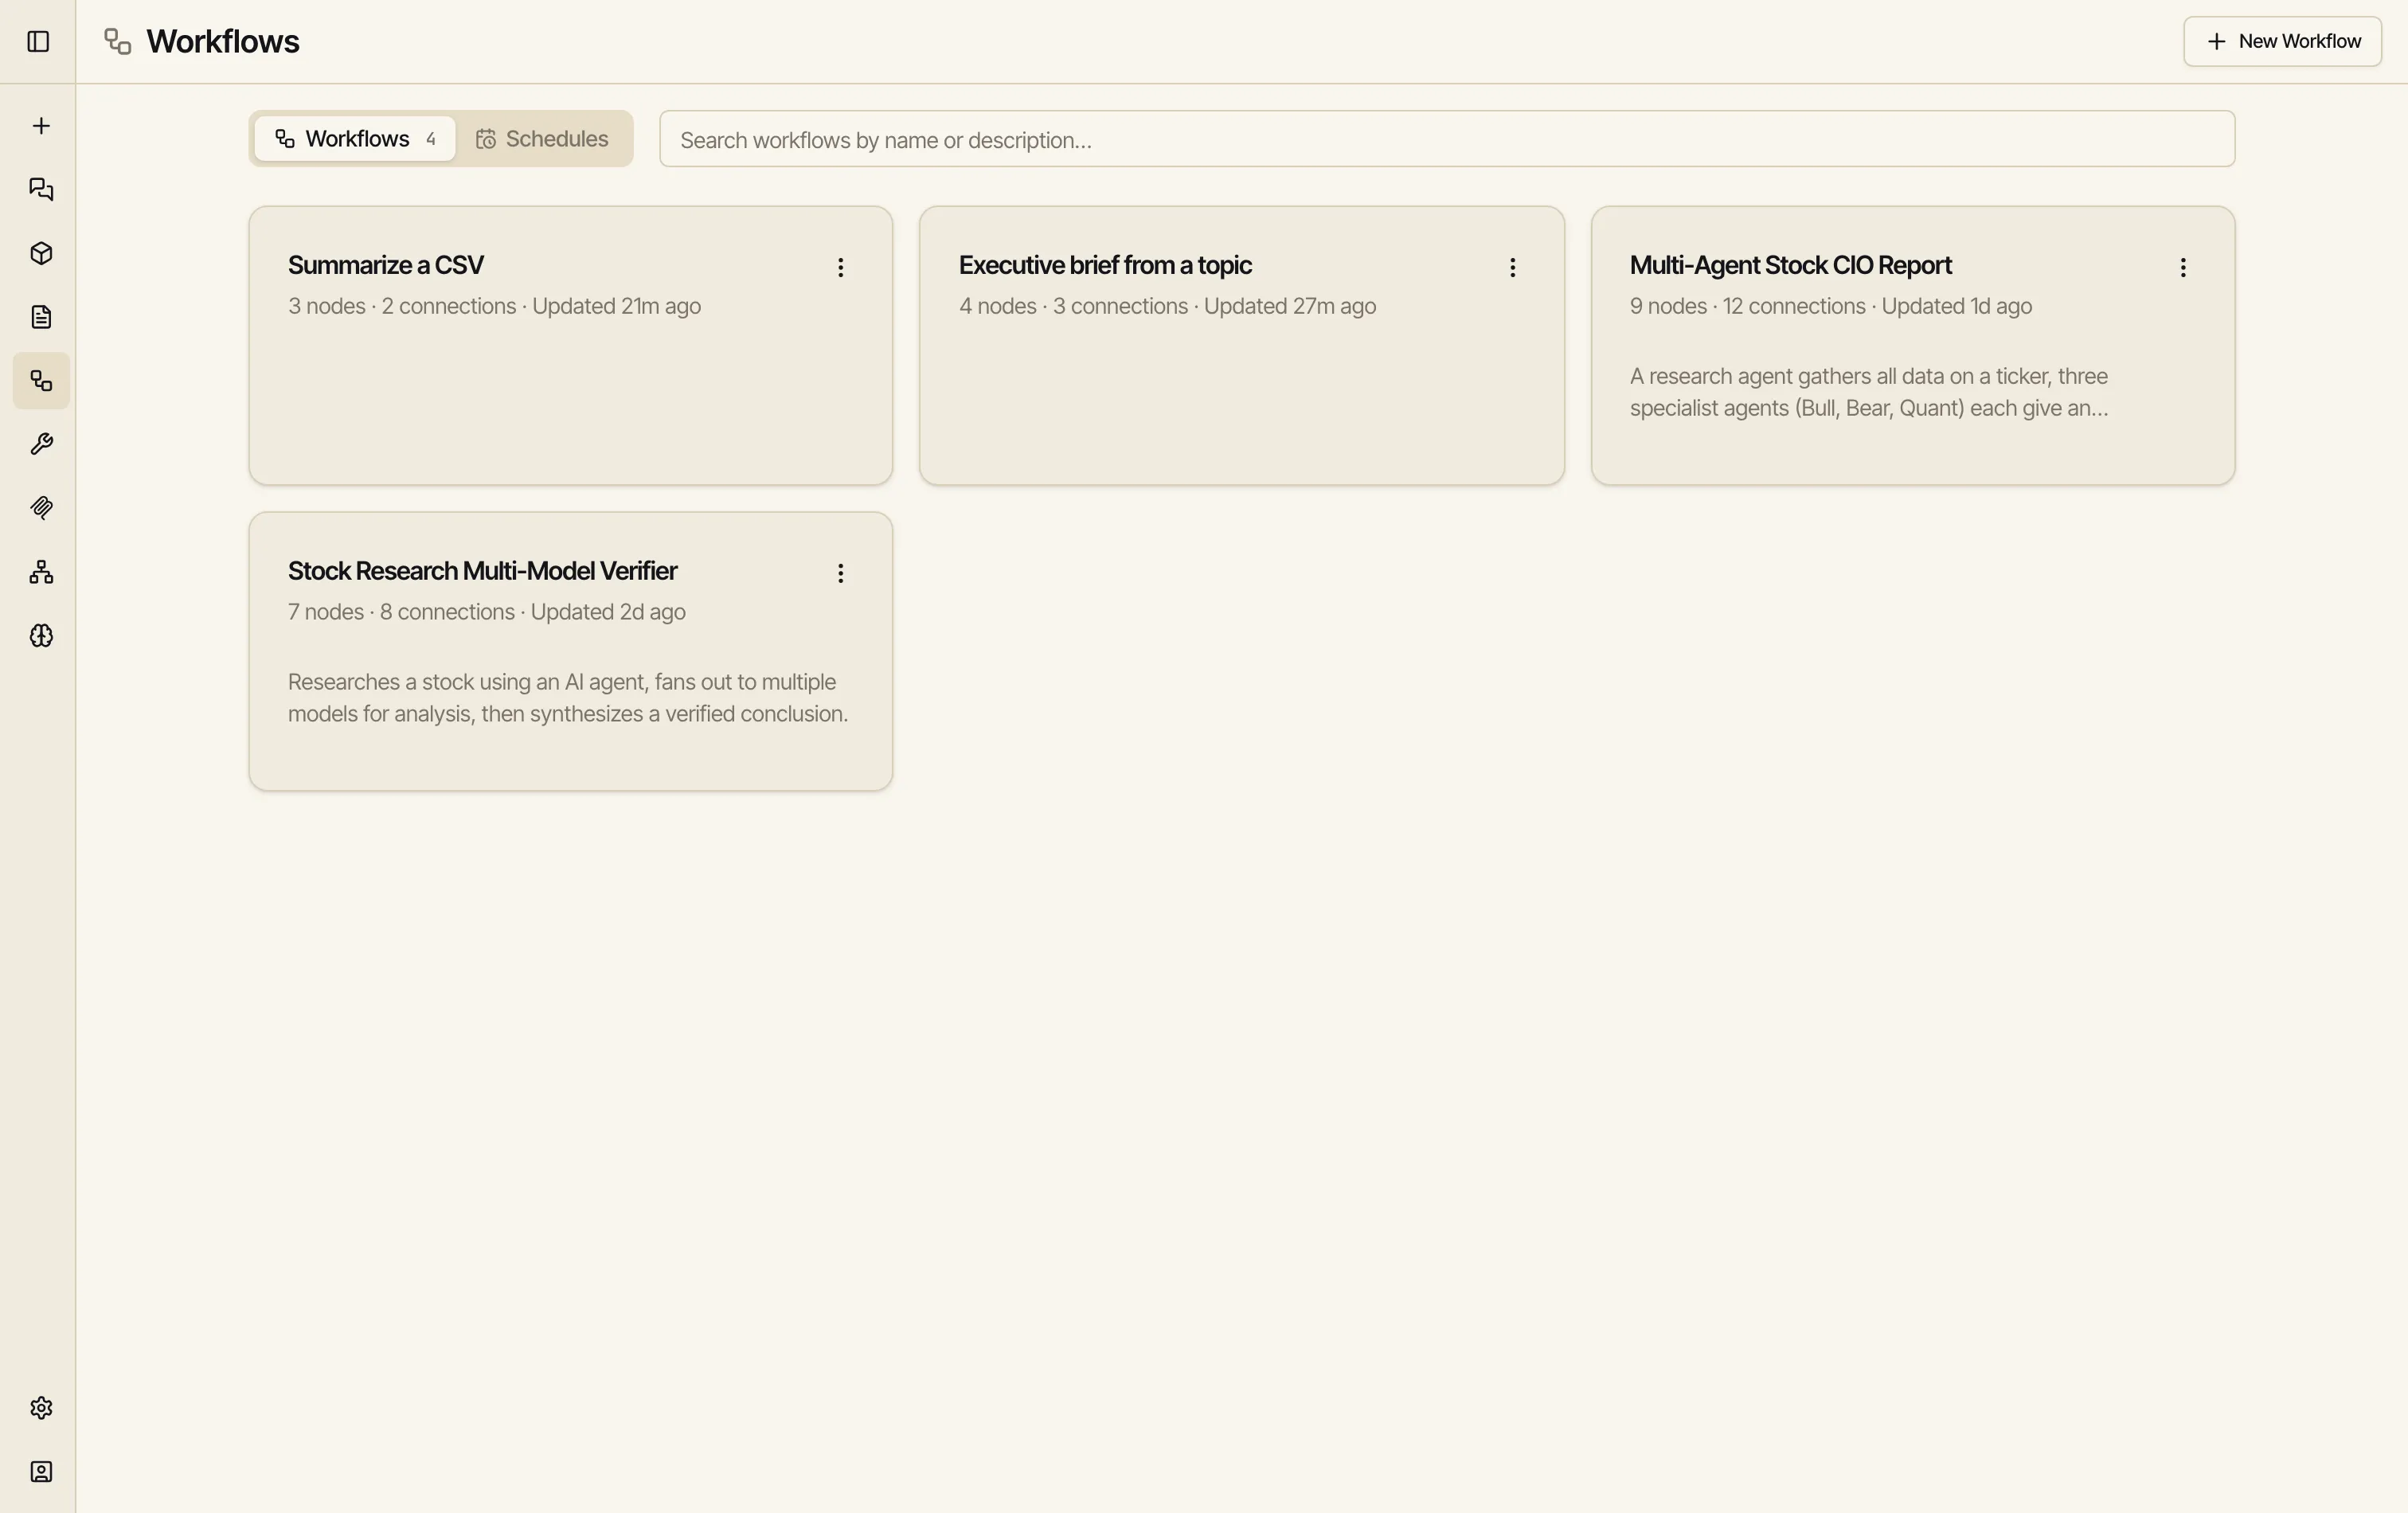
Section titled “Save it”Click Save and the workflow joins your Workflows list, with its node and connection counts — ready to run again, schedule, or share.
A second example: crunch a CSV with Python
Section titled “A second example: crunch a CSV with Python”Not every workflow needs a model. Sometimes you just want to run code over a file you bring.
You can attach a file to the workflow and read it from a Python node — the file mounts
read-only at inputs/<name> inside the sandbox on every run. Here’s a tiny one: Input →
Python (pandas) → Output over a sales.csv.
-
Attach the file. Click Files in the toolbar, then Attach file, and pick your CSV. It’s now bundled with the workflow — every run sees it at
inputs/sales.csv.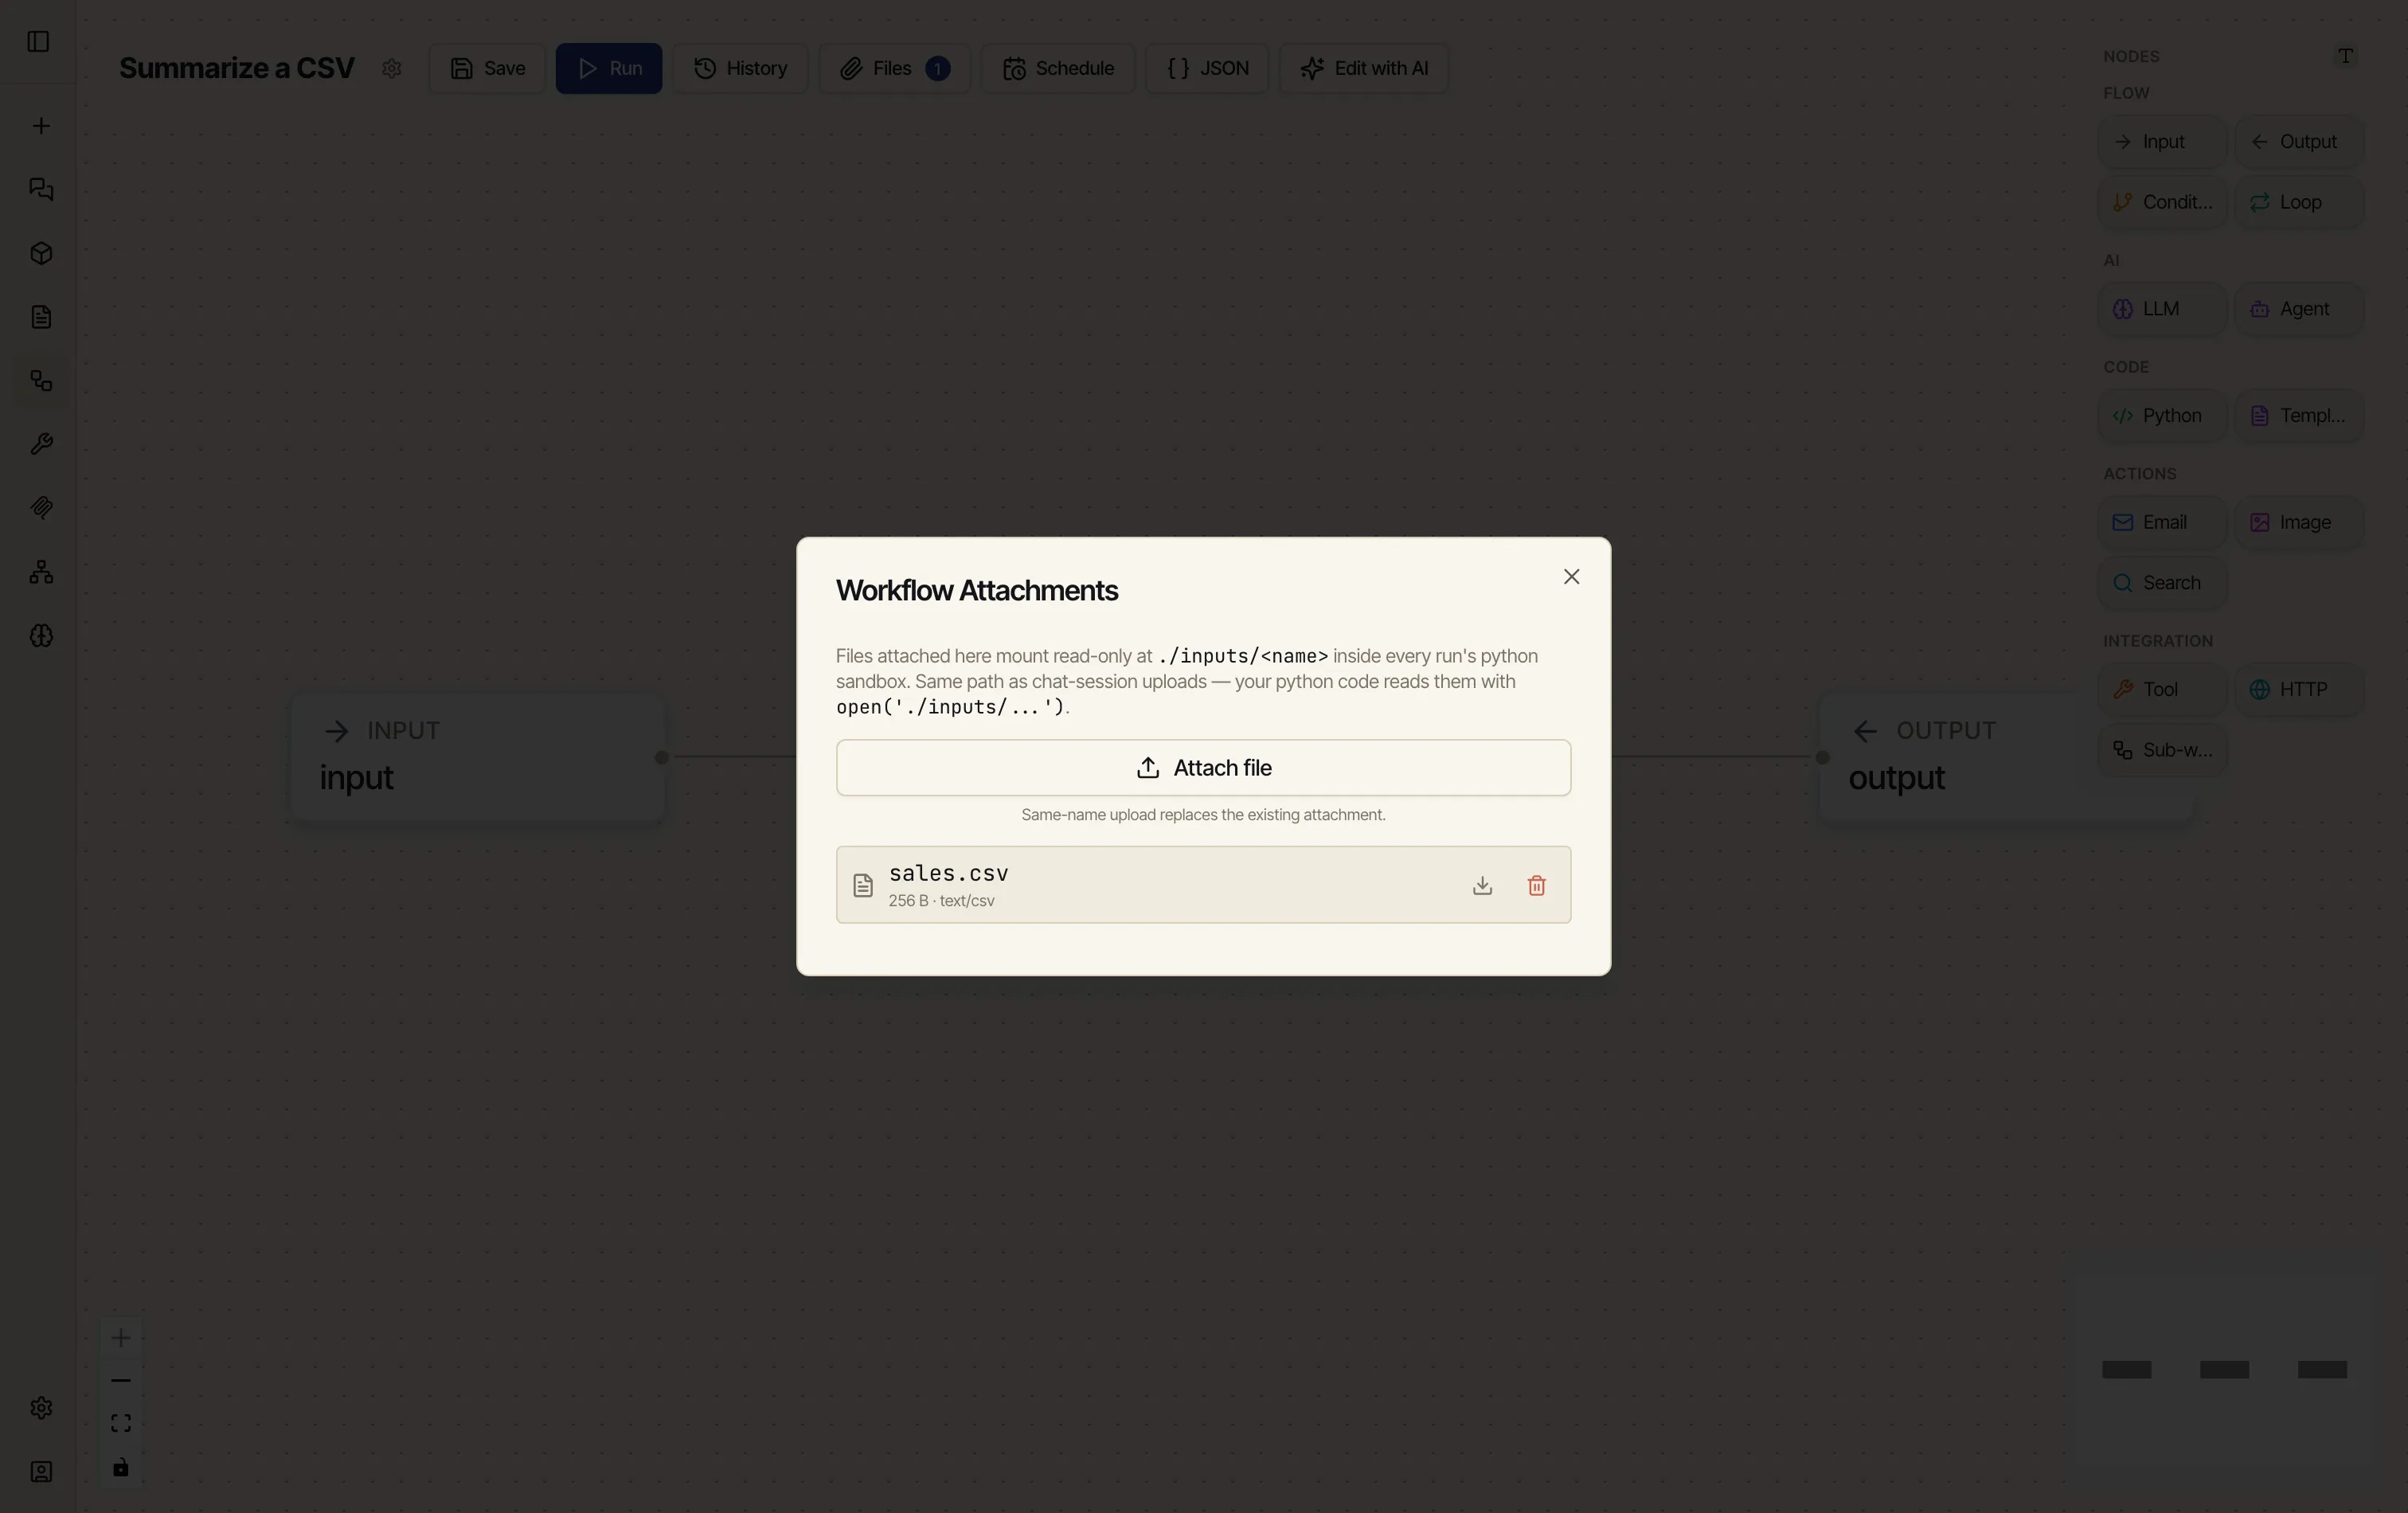
-
Read it in Python. Drag a Python node on and read the file with pandas — here we coerce a messy column, then total revenue by region:
import pandas as pd# Files attached to the workflow are mounted read-only at inputs/.df = pd.read_csv("inputs/sales.csv")# Coerce a messy column and total revenue by region.df["units"] = pd.to_numeric(df["units"], errors="coerce").fillna(0).astype(int)by_region = df.groupby("region")["revenue"].sum().sort_values(ascending=False)result = {"rows": int(len(df)),"total_revenue": int(df["revenue"].sum()),"top_region": by_region.index[0],"by_region": {r: int(v) for r, v in by_region.items()},}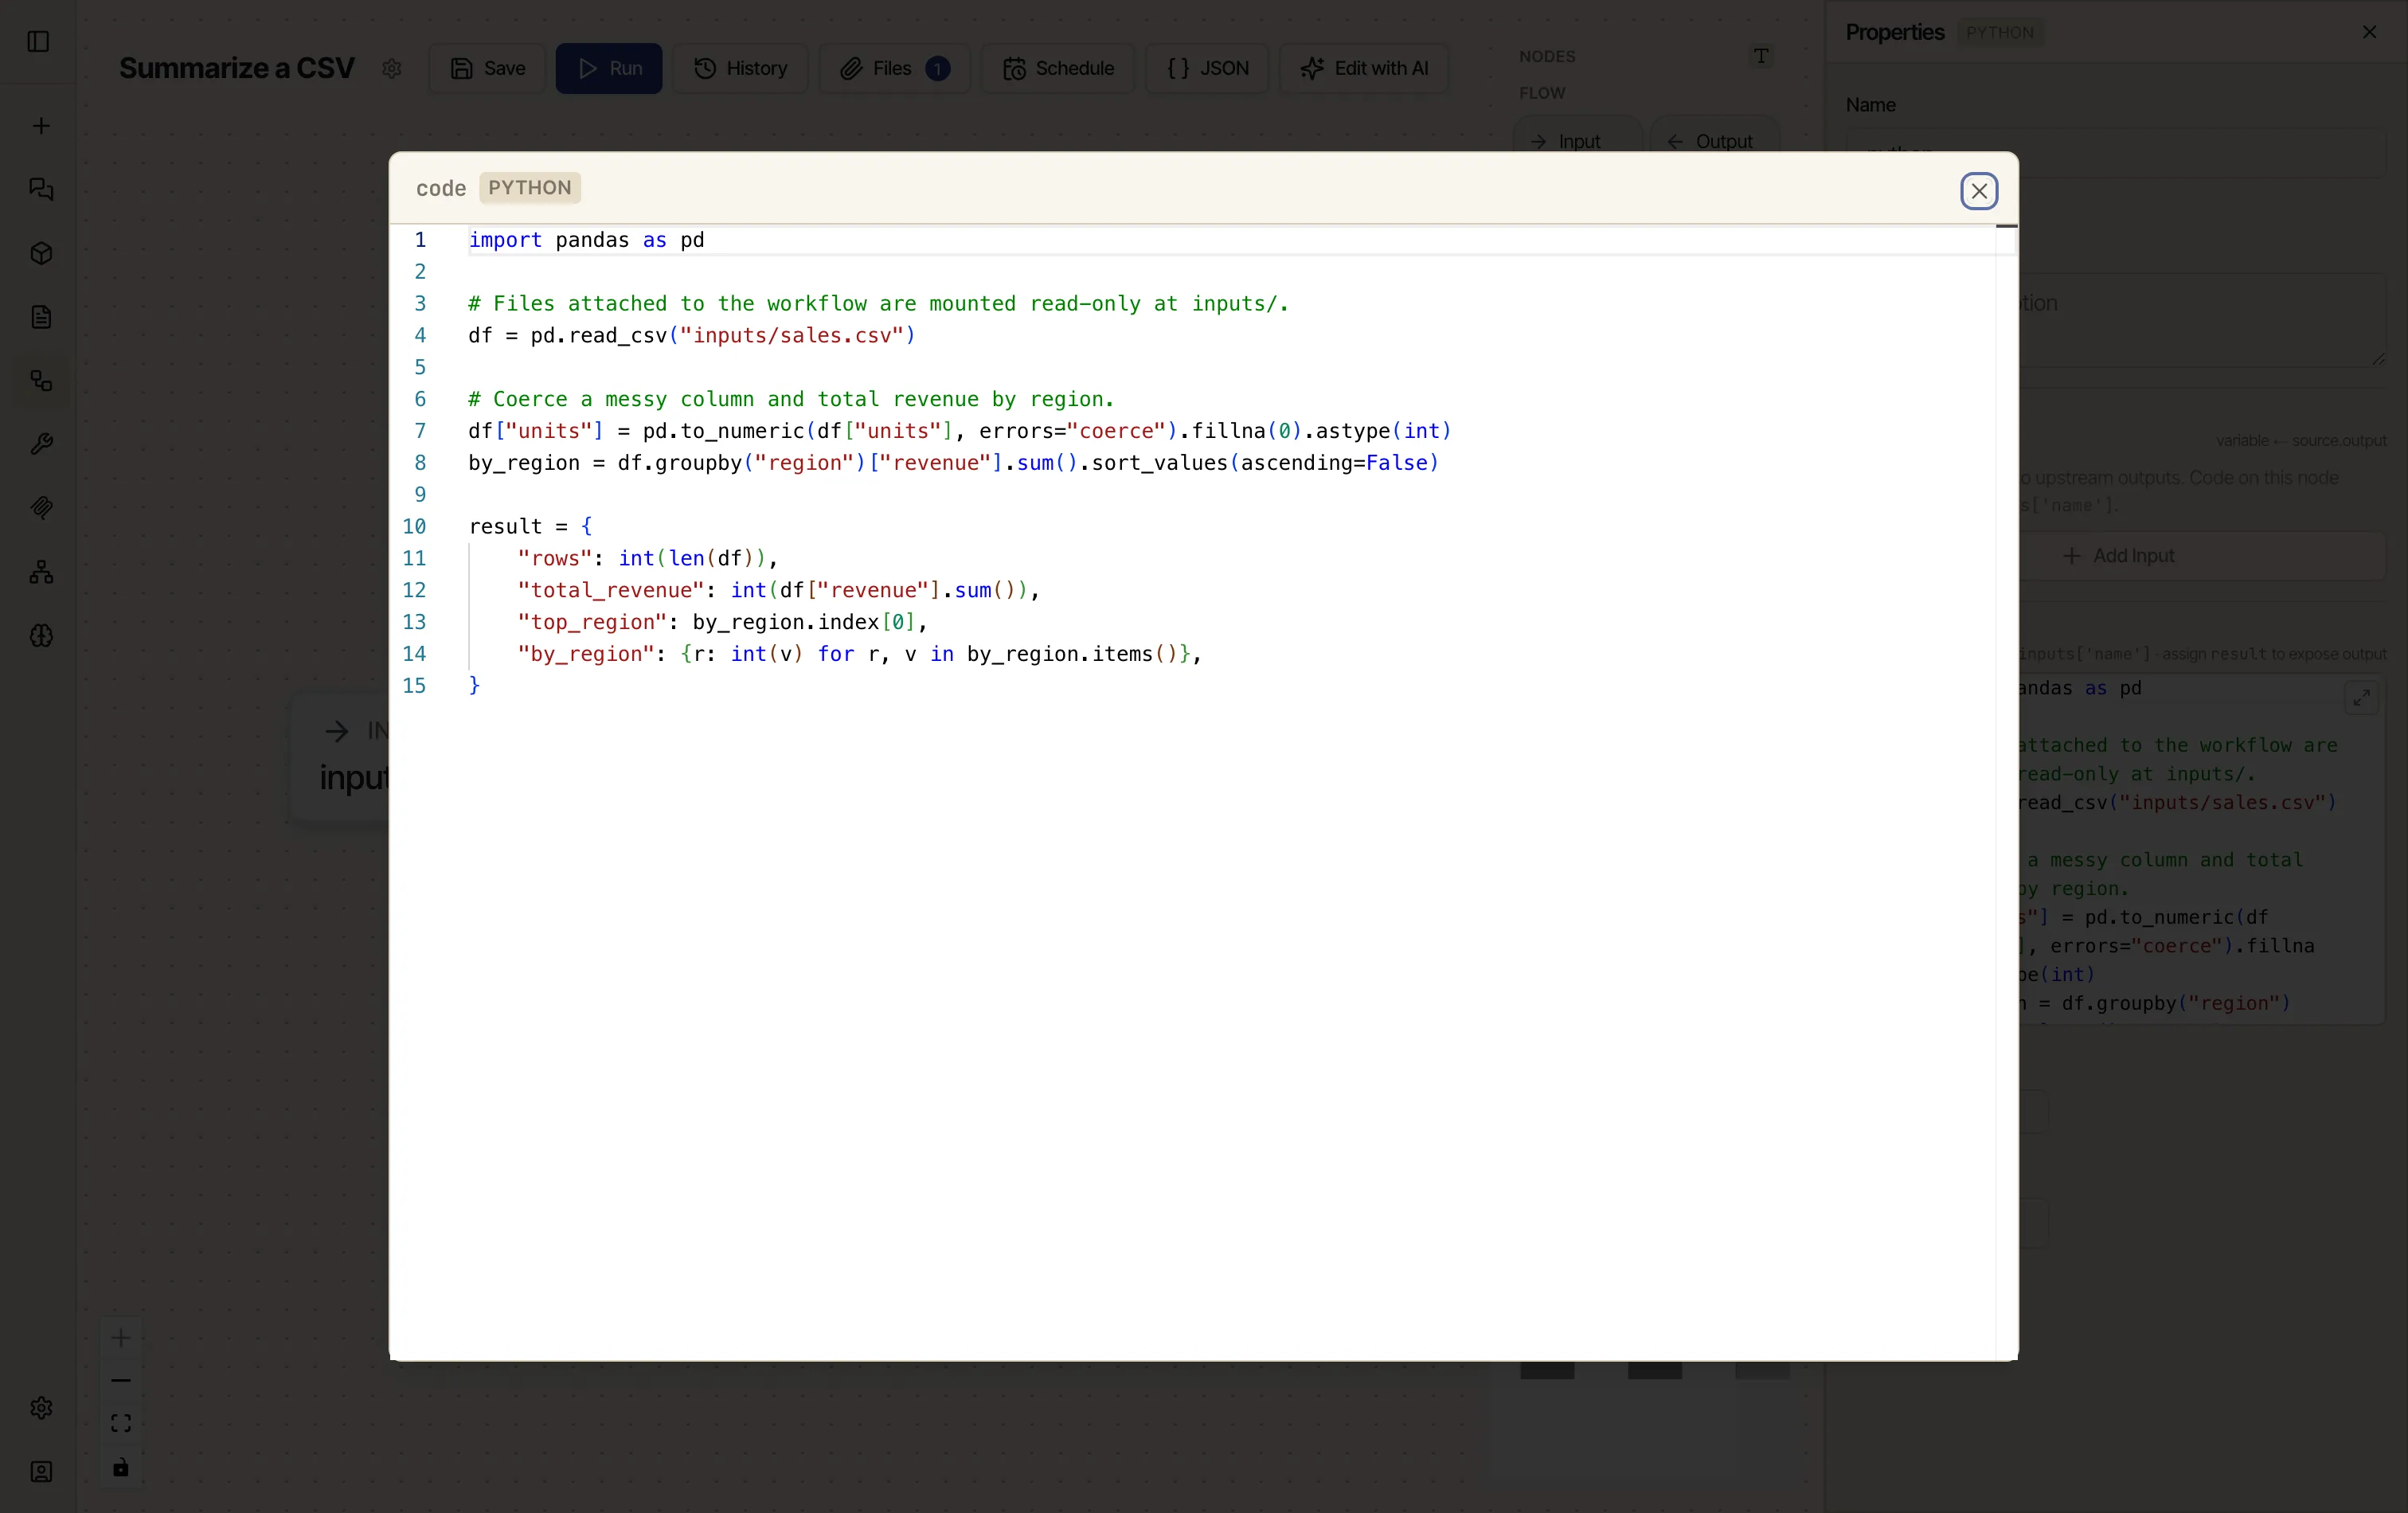
The sandbox ships with pandas, numpy, matplotlib and other common libraries, so there’s nothing to install.
-
Map the outputs and run. Point an Output node at
{{ python.result.rows }},{{ python.result.total_revenue }},{{ python.result.top_region }}, and{{ python.result.by_region }}. This workflow has no parameters, so Run executes straight away — it reads the attached CSV and returns the summary.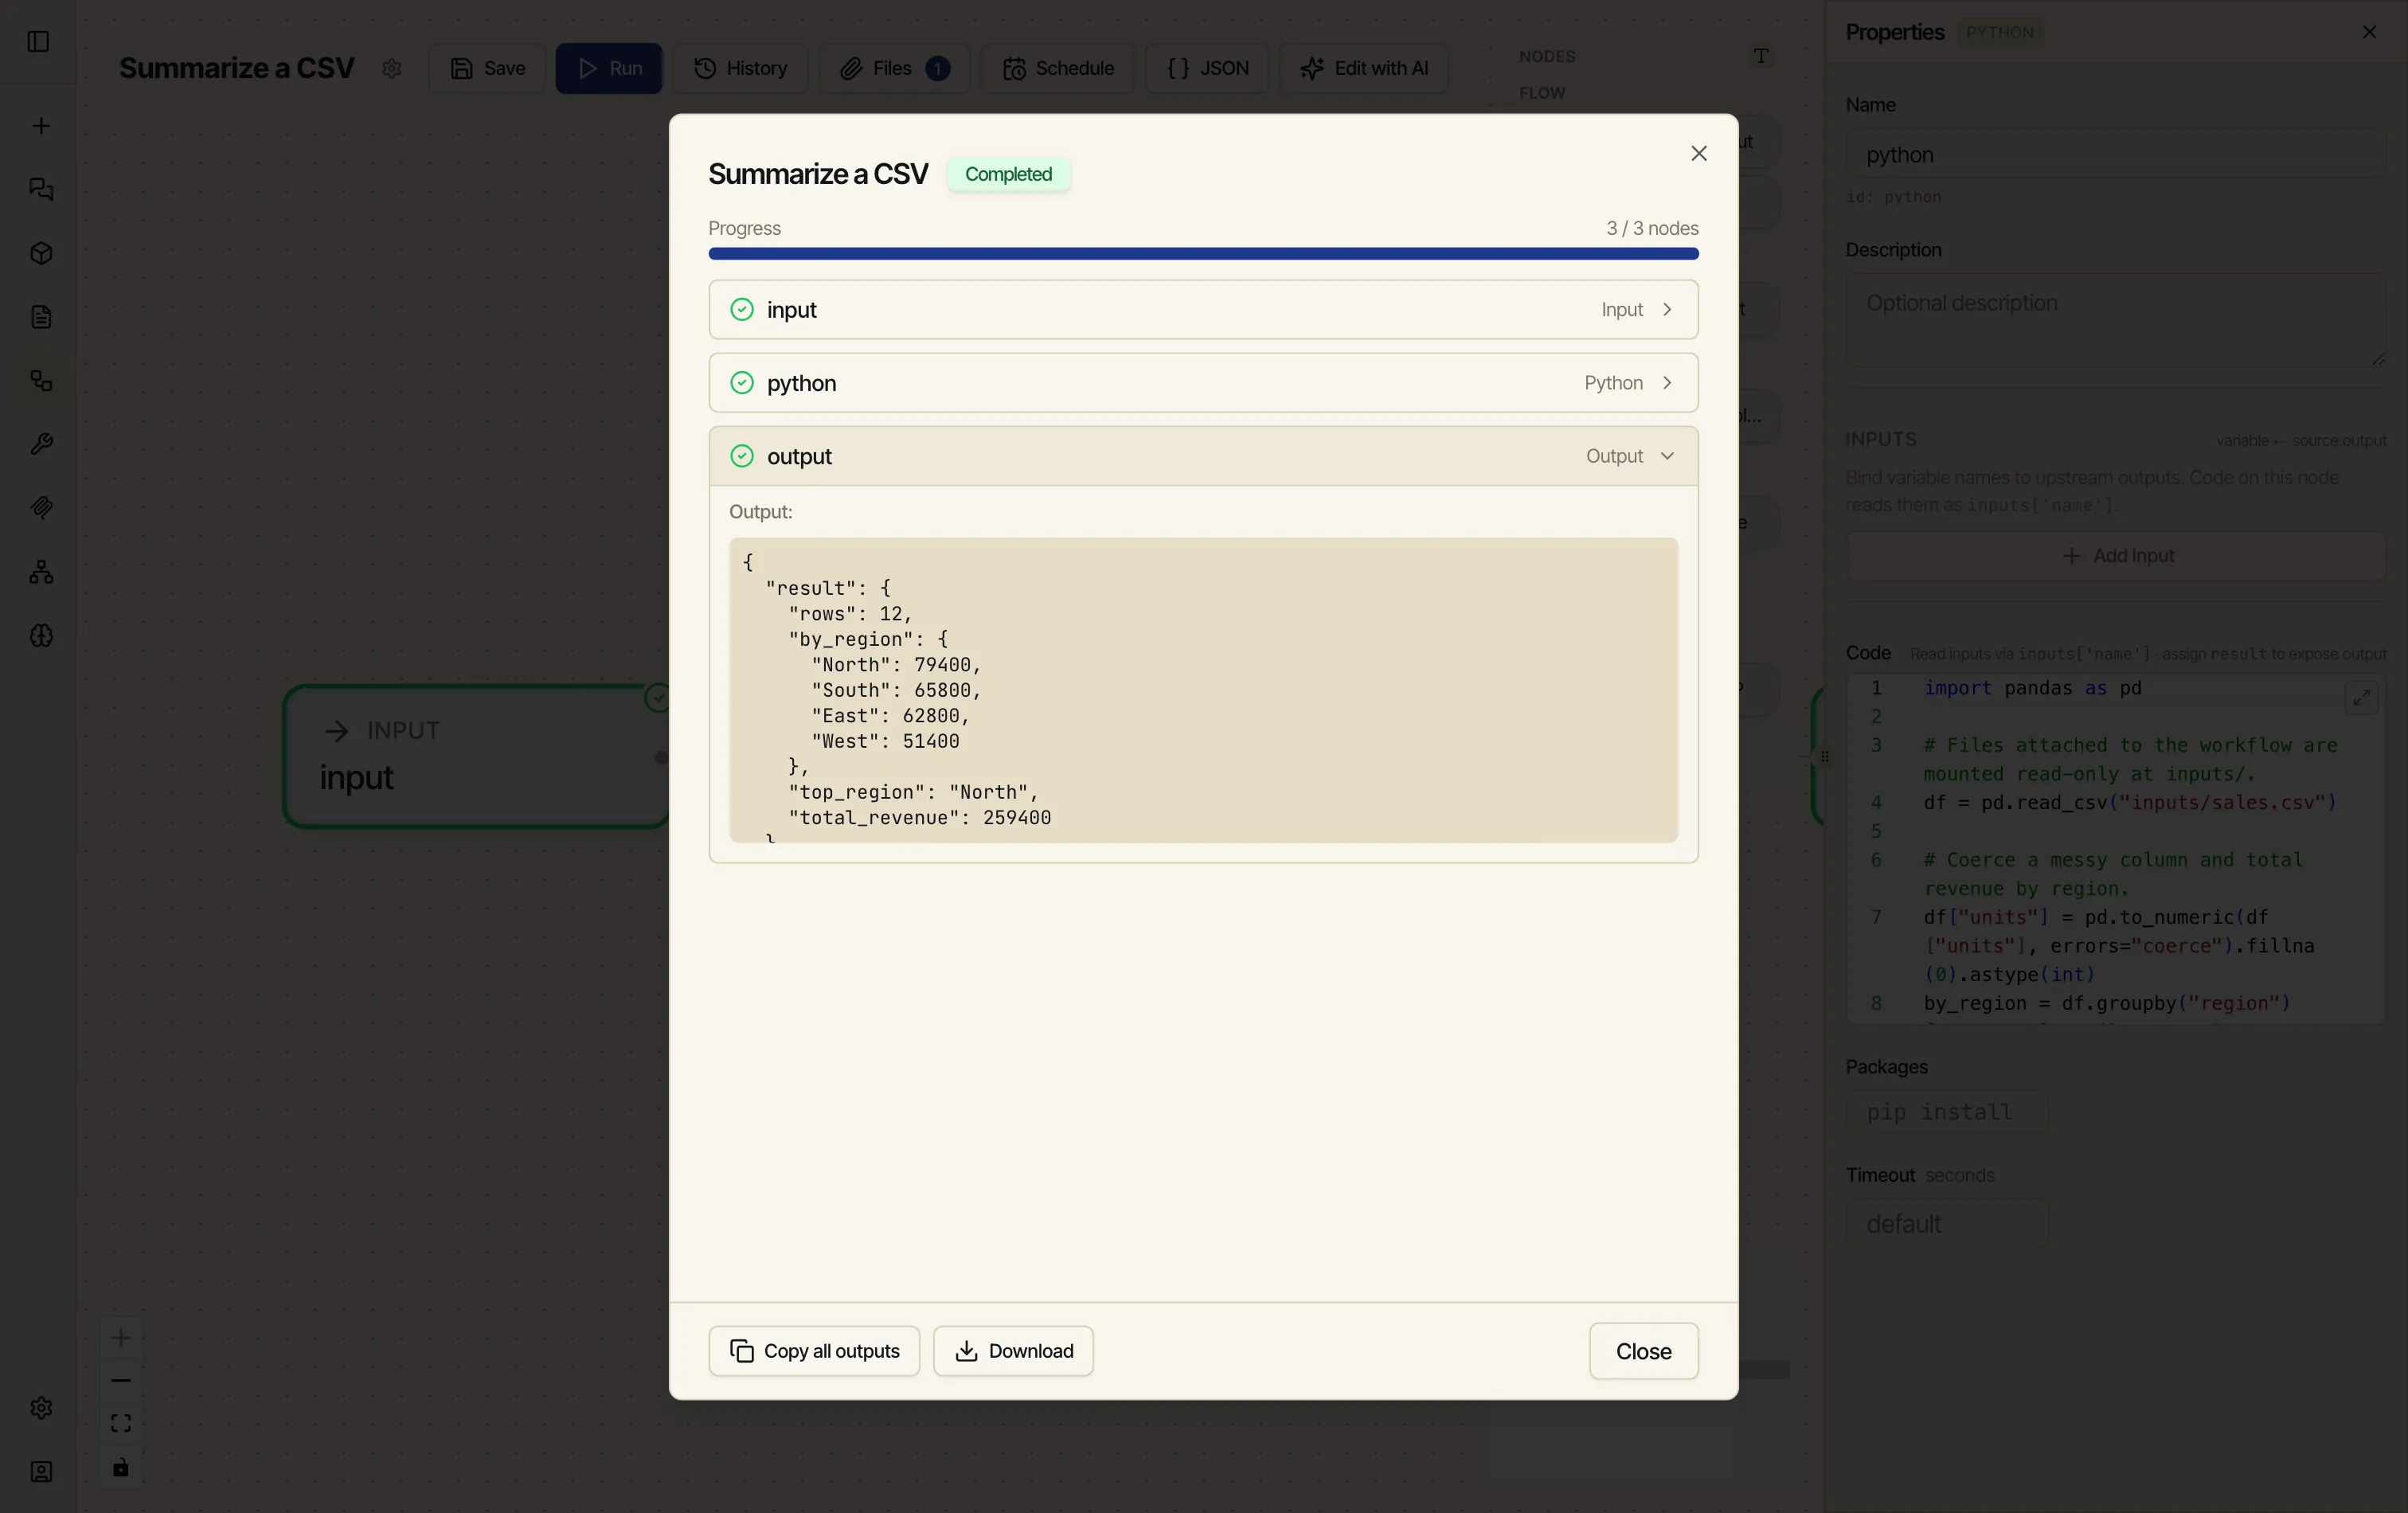
Referring to other nodes
Section titled “Referring to other nodes”The one idea that unlocks everything: a node reads another node’s output by name, written as
{{ nodename.field }}.
{{ input.parameters.topic }}— thetopicvalue you supplied to the input node.{{ llm.text }}— the llm node’s generated text.{{ python.result.numbered }}— thenumberedkey inside the python node’sresult.
Each node type publishes its own fields — an LLM node has text, a Python node has result,
an Input node has parameters. If you mistype a name, the run stops and tells you exactly which
reference was wrong — better a clear error than a silent wrong answer.
- File & image inputs — take a picture or a file as input and feed it to a vision model or a Python node.
- Node reference — every node type and the fields it publishes.
- Agents and Loops — for steps that need to think and iterate.
- Edit with AI — open the editor’s built-in assistant and change the workflow by describing the change.
- Scheduling and Delivery — make it run itself and send you the result.